Lab 5
In this lab we investigate fish population growth and the effects of various
types of harvesting on the fish population over the long term.
P.F. Verhulst, a
19
 centry Belgian Mathematician and Biologist, is credited as having suggested
the best population growth pattern equation, the logistic model. It combines
the concepts of exponential growth,
centry Belgian Mathematician and Biologist, is credited as having suggested
the best population growth pattern equation, the logistic model. It combines
the concepts of exponential growth,
 and limited growth
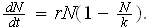
 into the following equation
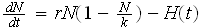
 Which can be readly modified the reflect harvesting into
 where
where
 is the harvesting function. We will explore the following 4 situations:
1. No harvesting (no fishing):

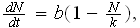
2. Constant effort harvesting:
 in 2,3,&
4
in 2,3,&
4  is a constant
3. Constant harvesting:

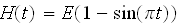
4. Perodic harvesting:
For all of the above situations use
 and
and
 &
&
 and
and
Situation 1. The purpose of this is to determine the biomass of fish the lake
will hold. Examine the long term effect of various initial stockings of fish
by the Fish and Game people.
 ,
,


 Use algebra to find the equilibrium value and compare this answer to the
graphs . What is the max. capicity of the lake?
Use algebra to find the equilibrium value and compare this answer to the
graphs . What is the max. capicity of the lake?
Situation 2. Here the haversting effort is directly proportional to the fish
population in the lake. For this problem consider the constant of
proportionality,
 Run graphs for this model for


 Compare these graphs with the graphs in situation 1. Again use algebra to
find the equilibrium value and compare this answer to the graphs and to
situation 1.
Compare these graphs with the graphs in situation 1. Again use algebra to
find the equilibrium value and compare this answer to the graphs and to
situation 1.
Situation 3. Here we have a constant harvesting rate that is not connected to
anything (except maybe the lake owners greed). We will look at 2 different
harvesting rates
 and
and
 using 3 initial populations
 (2 printouts, 3 graphs/printout). What do these graphs say about the long
term outlook for fish in the lake?
(2 printouts, 3 graphs/printout). What do these graphs say about the long
term outlook for fish in the lake?
(Special note: if the
population is killed out ODE Ar. will give a note to the effect that it cannot
continue and give the desired accuracy. Say ok and go on.)
Situation 4. Now we get fancy and look at perodic harvesting. Again we will
look at 2 different harvesting situations: first where
 and second when
 . In each look at the initial conditions


 (2 printouts, 4 graphs/printout). What do these graphs say about the long
term outlook for fish in the lake?
(2 printouts, 4 graphs/printout). What do these graphs say about the long
term outlook for fish in the lake?
Now use the questions with each section as a basis for a letter to the owners
of the lake recommending a fishing scheme. Consider that you are the
authority and they are paying for your recommendation so make it good.
Thanks to Tom Wangler, Illinois Benedictine College, and Paul Willams,
ACC Physics, for the ideas upon which this lab is based.
This document created by Scientific Notebook 4.1.