 .
.
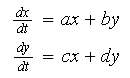
Phase portraits are used to visualize the effect of a rate of change
(differential Equation) over an extended time period. In this lab we are
going to look at the eigenvalues and phase portraits of homogeneous systems of
linear ODE's with two dependant variables:
![]() .
.
The understanding of these is needed to be able to investigate the behavior of non-linear systems found in problems having to do with population models of 2 species and the long term outlook of same. These include predator-prey, competing species and cooperating species situations.
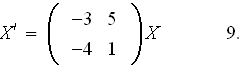
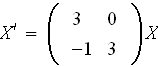
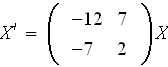
Instructions: 1. Print slopefield/phase portrait for each system.
2. Find the eigenvalues and eigenvectors of each system, this will be done in class.
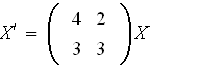
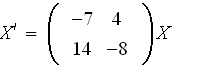
1.
![]()
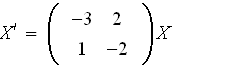
 2
2![]()

![]()
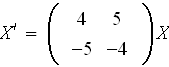
 3.
3.
![]()
![]()

![]()

![]()
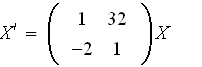
 5.
5.
![]()
 6
6![]()

![]()
7.
![]()
 8
8![]()

![]()
![]()
10.
![]()
To graph using ODE Architect enter equations in the form
![]()
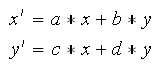
On the IC page set the interval to 3.
Go to the x-y tab under the graph area.
Now go to the menu for that graph andcheck for direction field. Next in the menu go to edit and put arrows on the fields and last under menu set the scales for some reasonable region -a to a, -b to b (a=b is not necessary)
Last Graph several solutions using various initial conditions, be sure to run both forward and backward.
This document created by Scientific Notebook 4.1.