![]()
![]()
![]()
Calculus IV
Lab 2
Non-Cartesian coordinate systems
Introduction
Mathematica supports a very wide range of 3-dimensional coordinate systems. (Double-click on VectorAnalysis and then hit function key F1 to go to the place in the Help Browser where these are discussed.) This can be very useful, but it can also be very confusing. How do you know what these different coordinate systems "look like" and when to use each one?
Well, this lab won't teach you that. However, it will show you some techniques to investigate this question and how to deal with these alternate coordinate systems in Mathematica.
First, we will work through an investigation of some properties of different coordinate systems using the two main non-Cartesian systems that we are most familiar with. Then, you will apply these techniques to some less familiar ones. (For all the work that follows, you must load the library module Calculus`VectorAnalysis`. In this notebook, it is done automatically when you execute the first command.)
Since we are in 3 dimensions here, we need 3 coordinates to specify a point in space. To find out what names Mathematica gives to these coordinates by defaulty, use:
![Coordinates[Cylindrical]](HTMLFiles/index_4.gif)
![]()
So, what are the transformation equations to convert from Cylindrical to Cartesian coordinates?
![CoordinatesToCartesian[{r, θ, z}, Cylindrical]](HTMLFiles/index_6.gif)
![{r Cos[θ], r Sin[θ], z}](HTMLFiles/index_7.gif)
(Notice that I used my own variable names here. This makes the formulae look nicer. It can get you in trouble on occasion, however. More on that later.)
So, what about Spherical coordinates?
![Coordinates[Spherical]](HTMLFiles/index_8.gif)
![]()
![CoordinatesToCartesian[{ρ, ϕ, θ}, Spherical]](HTMLFiles/index_10.gif)
![{ρ Cos[θ] Sin[ϕ], ρ Sin[θ] Sin[ϕ], ρ Cos[ϕ]}](HTMLFiles/index_11.gif)
Just a warning here: For some reason, Mathematica reverses the standard roles of θ and φ in spherical coordinates. In Mathematica, θ stands for the angle from the Z axis, while φ is the angle of the projection into the XY plane from the X axis. This isn't all that hard to deal with (just always remember to enter points in {ρ,φ,θ} format, rather than the more usual {ρ,θ,φ} form, using our standard θ and φ), but you do have to be careful to remember it.
Visualization
So, how can you visualize what these alternate coordinate systems "look like"? This can be a bit tricky, so I will show you one way to do this.
Consider a coordinate system {u,v,w}. If you fix w and let u and v vary, you will get a surface (why?). If you do this for different values of w, you will get a bunch of surfaces that are "parallel" in some sense (literally, in Cartesian coordinates). These can be thought of as "level surfaces" for the coordinate system: everything on one of these surfaces has the same w coordinate. You can do the same thing for u and v by letting each of them stay constant. Putting all these together give a pretty good picture of how the coordinate system behaves. Let's take a look at this for Cartesian and Spherical coordinates:
First, you use the Table function to generate your "level surfaces" for each combination of variables. Notice that the Table function works like:
Table[ Stuff to do for different values of k, {k, kStart, kEnd, kStep}]
where:
kStart = The beginning value to plug in for k
kEnd = The final value to plug in for k
kStep = The amount to increment k by each time
So, when I use the command:
Table[ParametricPlot3D[ stuff...], {k,-4,4,2}]
I am telling it to make a series of ParametricPlot3D's, letting k = -4, -2, 0, 2, 4.
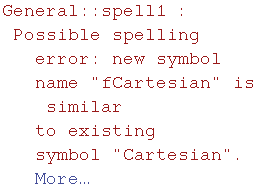
(You can ignore the "spelling error" messages. Mathematica is trying to be helpful, but not succeding very well here.)
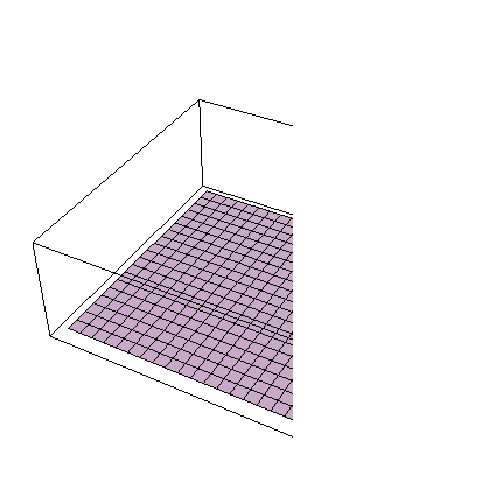
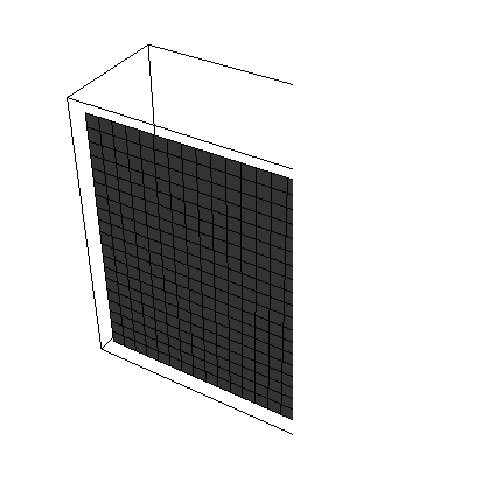
![zSlices = Table[ParametricPlot3D[{u, v, k}, {u, -5, 5}, {v, -5, 5}], {k, -4, 4, 2}]](HTMLFiles/index_12.gif)
![ySlices = Table[ParametricPlot3D[{u, k, v}, {u, -5, 5}, {v, -5, 5}], {k, -4, 4, 2}]](HTMLFiles/index_20.gif)

![xSlices = Table[ParametricPlot3D[{k, u, v}, {u, -5, 5}, {v, -5, 5}], {k, -4, 4, 2}]](HTMLFiles/index_29.gif)

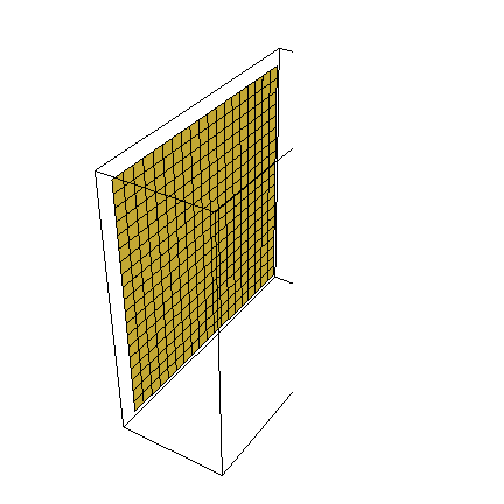

Notice that in each of these, u and v are used as variables for graphing the surface, while k always stands for the variable that will get held constant for each surface. Now, let's put all this together in a useful picture:
![Show[xSlices, ySlices, zSlices]](HTMLFiles/index_38.gif)
![]()
Not surprisingly, we see that Cartesian coordinates can be thought of as a bunch of intersecting planes. You locate points at the intersection of the three perpindicular planes. This is boring, but makes for a good start.
A couple of things you should notice about how I set this up:
I didn't let k run over as large a domain as I did u and v. This was so that when I put everything together at the end (using the Show command), we could actually see the intersecting planes. (If you let k run from -5 to 5, like u and v, all you see is a cube. Perfectly correct, but not very informative.)
You will probably have to experiment with the domain for u and v, as well as the range for k (and the number of slices) in different coordinate systems to come up with an informative final graph.
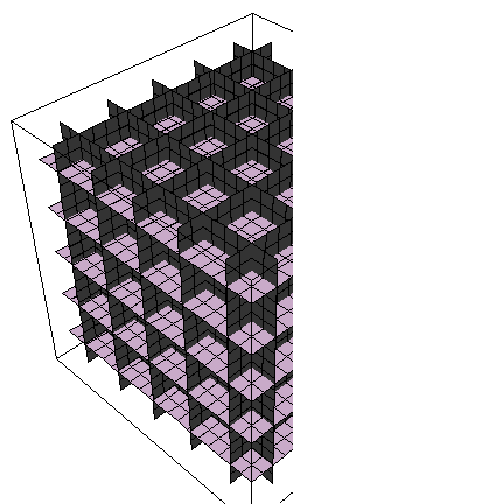
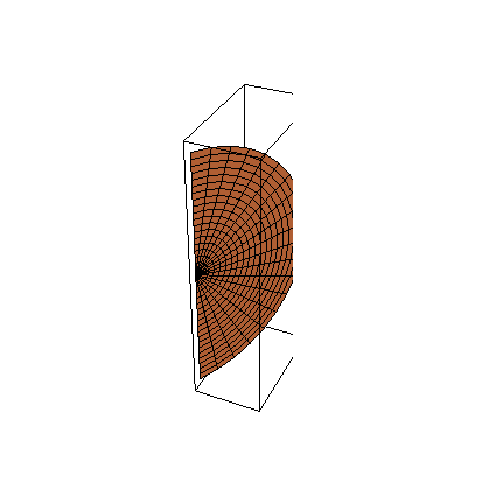
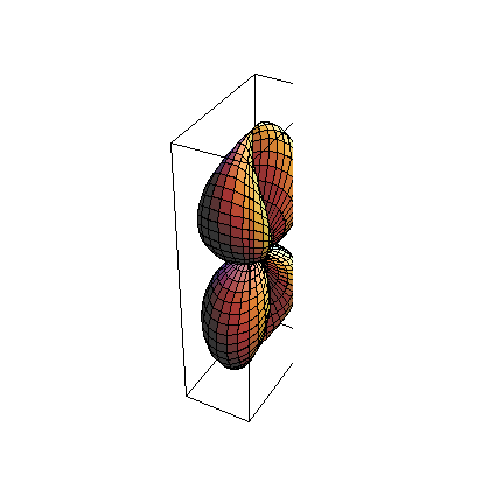
Let's do the same thing for Spherical coordinates. Notices that it is very similar, though we have to convert to Cartesian coordinates before we can plot anything (ParametricPlot3D plots only in Cartesian). Also, notice the use of Evaluate before the change of coordinates; this is just to stop Mathematica complaining (it compiles the function before plotting).
![ρSlices = Table[ParametricPlot3D[Evaluate[CoordinatesToCartesian[{k, ϕ, θ}, Spherical]], {ϕ, 0, π}, {θ, π/6, (11π)/6}], {k, 1, 5, 2}]](HTMLFiles/index_41.gif)
Notice that I didn't complete the spheres (I restricted θ). I did this so that when we put the graphs together, you can get a "cut-away" view inside (see below).
![θSlices = Table[ParametricPlot3D[Evaluate[CoordinatesToCartesian[{ρ, ϕ, k}, Spherical]], {ϕ, 0, π}, {ρ, 0, 6}], {k, π/3, (5π)/3, π/3}]](HTMLFiles/index_47.gif)


![ϕSlices = Table[ParametricPlot3D[Evaluate[CoordinatesToCartesian[{ρ, k, θ}, Spherical]], {θ, π/6, (11π)/6}, {ρ, 0, 6}], {k, 0, π, π/6}]](HTMLFiles/index_56.gif)

![Show[ρSlices, θSlices, ϕSlices]](HTMLFiles/index_67.gif)
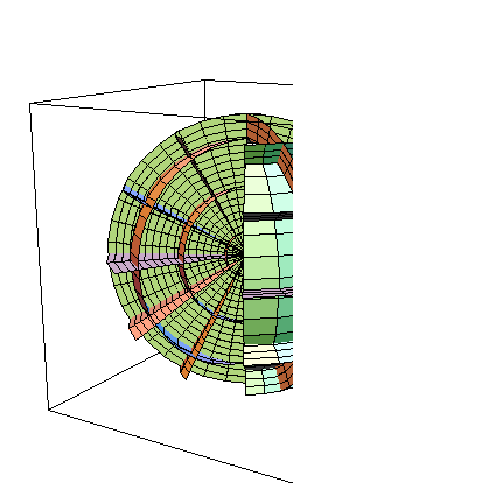
![]()
Again, you locate points at the intersection of the three types of surfaces (planes, spheres, and cones).
Problem:
Pick three other non-standard coordinate systems that Mathematica supports (listed in the Help Browser page I mention above; Cartesian, Cylindrical, and Spherical are all out) and generate visualizations of those systems like I did above. Also, have Mathematica give you the formula to translate from these other coordinate systmes into Cartesian. Choose your domains, etc., so that your final picture is easy to interpret.
Warning: Some of the coordinate systems in the list seem to have more than 3 coordinates. This isn't really true; the first 3 variables listed are always the coordinates. The "extra" variables are actually constant parameters; you get a slightly different coordinate system for each choice of those parameters. You can use the default values for each one for this exercise.
Computations
While alternate coordinate systems can be really useful at times (especially in integration), you do have to be careful when working with them. Standard vector operations work differently in non-Cartesian coordinate systems. However, you can always transform everything into Cartesian coordinates and do the work there if necessary. Fortunately, Mathematica automagically does most of the grunt work for you on this. Mathematica also has special versions of these operations that work in these different coordinate systems.
Vector operations
So, for example, to take the dot product of two vectors in spherical coordinates, we would do the following (warning: remember that these are in {ρ,φ,θ} form):
![DotProduct[{1, π/2, π/6}, {2, π/2, (2π)/3}, Spherical]](HTMLFiles/index_70.gif)
![]()
If we use Cartesian coordinates, we get:
![DotProduct[{1, π/2, π/6}, {2, π/2, (2π)/3}, Cartesian]](HTMLFiles/index_72.gif)
![CrossProduct[{1, π/2, π/6}, {2, π/2, (2π)/3}, Spherical]](HTMLFiles/index_74.gif)
![]()
![CrossProduct[{1, π/2, π/6}, {2, 0, (2π)/3}, Spherical]](HTMLFiles/index_76.gif)
![]()
Problem:
Explain why the dot product in spherical coordinates is 0 above. Why is the second dot product (in Cartesian coordinates, by default) not 0?
What coordinate system is the answer to the cross product given in? (This is important. Don't continue until you have figured this out.) How do you know?
Differentiation operators
There are also built-in functions to find the gradient, divergence, and curl (among other things):
![]()
![]()
Notice, we have a problem here. The gradient of the given functions is certainly not the 0 vector. So, what is going on? This goes back to the issue I mentioned in the introduction. This gradient was taken in the default coordinate system (Cartesian), but it was taken with the Mathematica default variables for that coordinate system. Let's find out what those are:
![]()
![]()
![]()
![]()
So, as far as Mathematica is concerned, the variables in this coordinate system are Xx, Yy, and Zz (strange but true). That means that when we took the gradient above, it treated x, y, and z as constants. There are two ways to fix this:
We could conform:
![Grad[Xx^2 + Yy Cos[Zz]]](HTMLFiles/index_84.gif)
![{2 Xx, Cos[Zz], -Yy Sin[Zz]}](HTMLFiles/index_85.gif)
Personally, I find this a bit bizarre to try to read. The other way is to tell Mathematica to use our preferred variables:
![Grad[x^2 + y Cos[z], Cartesian[x, y, z]]](HTMLFiles/index_86.gif)
![{2 x, Cos[z], -y Sin[z]}](HTMLFiles/index_87.gif)
Or, if you need to do a lot of work in Cartesian coordinates with your preferred variables, you could set the default coordinate system this way:
![SetCoordinates[Cartesian[x, y, z]]](HTMLFiles/index_88.gif)
![]()
![]()
![{2 x, Cos[z], -y Sin[z]}](HTMLFiles/index_91.gif)
![Grad[x^2 + y Cos[z], Cartesian[x, y, z]]](HTMLFiles/index_92.gif)
![{2 x, Cos[z], -y Sin[z]}](HTMLFiles/index_93.gif)
Thus, it is extremely important that, before you start doing computations in any coordinate system using Mathematica's built-in functions, you are aware of what variables Mathematica is expecting (or you set them like you want them).
Of course, a more interesting question is, how do these things work in other coordinate systems? Let's look at the gradient in spherical coordinates:
![Coordinates[Spherical]](HTMLFiles/index_94.gif)
![]()
![SetCoordinates[Spherical[ρ, ϕ, θ]]](HTMLFiles/index_96.gif)
![]()
Warning: The default coordinate system is now set to spherical until you change it again. The safe thing to do is to always specify the coordinate system when you perform a computation. Also, notice that I am taking this opportunity to rename the variables so they fit the ones we are used to (though they still need to be entered in {ρ,φ,θ} order).
![Grad[ρ^2Sin[ϕ] Cos[θ]]](HTMLFiles/index_98.gif)
![{2 ρ Cos[θ] Sin[ϕ], ρ Cos[θ] Cos[ϕ], -ρ Sin[θ]}](HTMLFiles/index_99.gif)
Or, we can get a general formula for the gradient of a function f[ρ,φ,θ] whose coordinates are in spherical coordinates:
![]()
![{f^(1, 0, 0)[ρ, ϕ, θ], f^(0, 1, 0)[ρ, ϕ, θ]/ρ, (Csc[ϕ] f^(0, 0, 1)[ρ, ϕ, θ])/ρ}](HTMLFiles/index_101.gif)
In this expression, ![]() [ρ,φ,θ] stands for the partial derivative of f with respect to the first coordinate (ρ), etc. Notice that, in addition to the expected partial derivatives, you get some extra coefficients, in this case
[ρ,φ,θ] stands for the partial derivative of f with respect to the first coordinate (ρ), etc. Notice that, in addition to the expected partial derivatives, you get some extra coefficients, in this case ![]() and
and ![]() (usually written as
(usually written as ![]() ). A complete treatment of where these factors come from is beyond the scope of this lab, but basically they are the reciprocals of the coefficients needed to convert a change in that variable into an actual change in arc-length (called the "Scale Factors"). So, in other words, if you increase ρ by dρ, then it just gets longer by dρ, so the scale factor is 1. However, if you increase φ by dφ, the actual change in distance (i.e., arc-length) covered is ρ dφ, so the scale factor is ρ. (This is easier to see in polar coordinates. If you increase θ by dθ, the actual change in arc-length is r dθ, so the scale factor would be r.) To see the scale factors for a particular coordinate system, you can use:
). A complete treatment of where these factors come from is beyond the scope of this lab, but basically they are the reciprocals of the coefficients needed to convert a change in that variable into an actual change in arc-length (called the "Scale Factors"). So, in other words, if you increase ρ by dρ, then it just gets longer by dρ, so the scale factor is 1. However, if you increase φ by dφ, the actual change in distance (i.e., arc-length) covered is ρ dφ, so the scale factor is ρ. (This is easier to see in polar coordinates. If you increase θ by dθ, the actual change in arc-length is r dθ, so the scale factor would be r.) To see the scale factors for a particular coordinate system, you can use:
![ScaleFactors[Spherical[ρ, ϕ, θ]]](HTMLFiles/index_106.gif)
![]()
![ScaleFactors[Cylindrical[r, θ, z]]](HTMLFiles/index_108.gif)
![]()
Now, you only have to deal with this when you need your output vectors given in your non-Cartesian coordinate system. In the cases we looked at above, the gradients are given as vectors in spherical coordinates (i.e., these are the components of unit vectors in the ρ, φ, and θ directions, respecitvely). This is mainly useful if you are doing all your work in that coordinate system. (The good news is that all the built-in differential operators, like grad, div, and curl, automatically take care of this for you, if you specify your coordinate system.)
On the other hand, if you really needed to work with a function from an alternate coordinate system in Cartesian coordinates (for example if you wanted to actually graph the function or its gradient vector field or tangent plane in Mathematica), one way to handle this is to convert the function to Cartesian coordintes to begin with.
If you had the function (in spherical coordinates):
![f[{ρ_, ϕ_, θ_}] := ρ^2Sin[ϕ] Cos[θ]](HTMLFiles/index_110.gif)
You could first transform it into a function of {x,y,z}:
![fCart[{x_, y_, z_}] = f[CoordinatesFromCartesian[{x, y, z}, Spherical]]//FullSimplify](HTMLFiles/index_111.gif)
![((x^2 + y^2) Cos[ArcTan[x, y]])/(x^2 + y^2)/(x^2 + y^2 + z^2)^(1/2)](HTMLFiles/index_112.gif)
From then on, you would treat this as a standard Cartesian function (admittedly ugly). Notice the liberal use of FullSimplify in this work; it is used to automatically apply things like trig identities, etc.
![Grad[fCart[{x, y, z}], Cartesian[x, y, z]]//FullSimplify](HTMLFiles/index_113.gif)
![{((x^2 + y^2)/(x^2 + y^2 + z^2)^(1/2) (2 x^2 + y^2 + z^2))/(x^2 + y^2)^(1/2), (x y (x^2 + y^ ... + y^2 + z^2)^(1/2))/(x^2 + y^2)^(1/2), z (x^2 + y^2)/(x^2 + y^2 + z^2)^(1/2) Cos[ArcTan[x, y]]}](HTMLFiles/index_114.gif)
This gives you the gradient in terms of your standard ![]() ,
, ![]() , and
, and ![]() unit vectors. You can get a much nicer looking gradient by taking it directly in spherical:
unit vectors. You can get a much nicer looking gradient by taking it directly in spherical:
![sphGrad = Grad[f[{ρ, ϕ, θ}], Spherical[ρ, ϕ, θ]]//FullSimplify](HTMLFiles/index_118.gif)
![{2 ρ Cos[θ] Sin[ϕ], ρ Cos[θ] Cos[ϕ], -ρ Sin[θ]}](HTMLFiles/index_119.gif)
But this gives you the gradient vector in terms of the unit vectors in the ρ, φ, and θ directions (referred to in our book as ![]() ,
, ![]() ,
, ![]() ). Which method you use depends on what you are trying to do. (Of course, with spherical and cylindrical coordinates, Mathematica is perfectly capable of graphing them "as-is", but that isn't true about other more esoteric coordinate systems. Also, if you were working with different functions in different coordinate systems, converting everything to Cartesian makes it possible to work with them all together.)
). Which method you use depends on what you are trying to do. (Of course, with spherical and cylindrical coordinates, Mathematica is perfectly capable of graphing them "as-is", but that isn't true about other more esoteric coordinate systems. Also, if you were working with different functions in different coordinate systems, converting everything to Cartesian makes it possible to work with them all together.)
![SetCoordinates[Cartesian[x, y, z]]](HTMLFiles/index_123.gif)
![]()
Integration operations
If you are computing a change of variables for a new coordinate system (i.e., in a triple integral), Mathematica has some built in functions that are useful for that as well:
![JacobianDeterminant[Spherical[ρ, ϕ, θ]]](HTMLFiles/index_125.gif)
![]()
![JacobianDeterminant[Cylindrical]](HTMLFiles/index_127.gif)
![]()
As usual, be sure you know what the default variables of your coordinate system are before using this:
![JacobianDeterminant[Cylindrical[r, θ, z]]](HTMLFiles/index_129.gif)
![]()
![SetCoordinates[Cartesian[x, y, z]]](HTMLFiles/index_131.gif)
![]()
Also, if you are doing a path integral, you will need to be able to find the "arc length factor", which is the factor you have to introduce to convert an integral ds into and integral dt (or whatever your independent variable is). Of course, since we know that ds=|![]() '(t)|dt, this "arc length factor" is just |
'(t)|dt, this "arc length factor" is just |![]() '(t)|. Now, you could certainly compute that yourself, but Mathematica has a built-in function for this:
'(t)|. Now, you could certainly compute that yourself, but Mathematica has a built-in function for this:
![ArcLengthFactor[{2Sin[t], 2Cos[t], t}, t]//FullSimplify](HTMLFiles/index_135.gif)
![]()
Now, even though we haven't really discussed this possibility in class, there isn't any reason you can't have curves defined in other coordinate systems. So, for example, you could define a parametric curve in cylindrical coordinates as: r=1, θ=t, z=t or, in vector form:
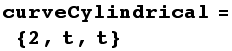
![]()
Now, if you just apply the ArcLengthFactor directly to this curve, you get:
![ArcLengthFactor[{2, t, t}, t]](HTMLFiles/index_139.gif)
![]()
Notice, that this is actually the same curve I defined above in Cartesian coordinates, a helix with a radius of 2 about the z axis (moving at the same "speed"). Therefore, they ought to have the same factors. The way to fix this, of course, is to tell Mathematica that your curve is actually specified in cylindrical coordinates (the above command assumed Cartesian):
![ArcLengthFactor[{2, t, t}, t, Cylindrical]](HTMLFiles/index_141.gif)
![]()
If you are curious about the actual formula:
![ArcLengthFactor[{x[t], y[t], z[t]}, t, Cartesian]](HTMLFiles/index_143.gif)
![(x^′[t]^2 + y^′[t]^2 + z^′[t]^2)^(1/2)](HTMLFiles/index_144.gif)
![ArcLengthFactor[{r[t], θ[t], z[t]}, t, Cylindrical]](HTMLFiles/index_145.gif)
![(r^′[t]^2 + z^′[t]^2 + r[t]^2 θ^′[t]^2)^(1/2)](HTMLFiles/index_146.gif)
Graphing
You can also graph functions and parametric equations in these coordinate systems. In Lab 1, you wrote your own translation functions to do this for spherical and cylindrical coordinates. Let's look at another way this could be done, using the built-in Mathematica coordinate systems.
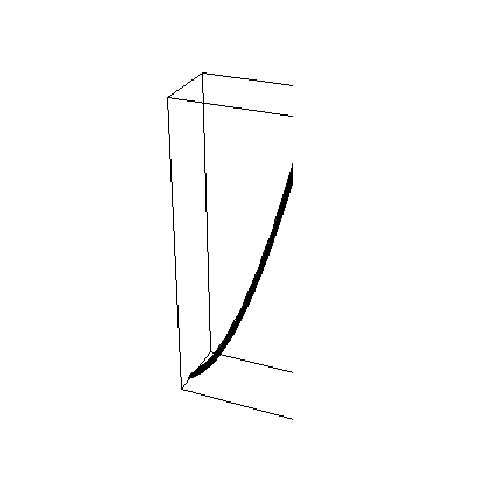
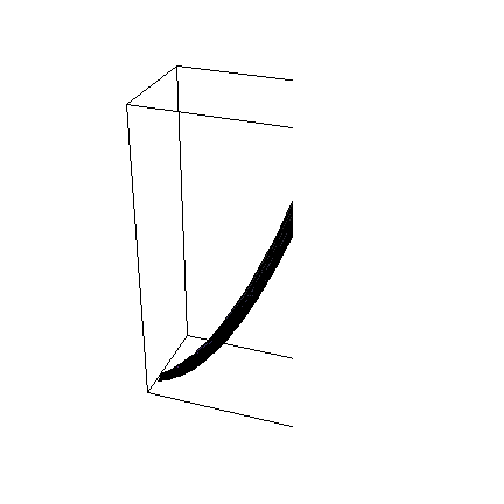
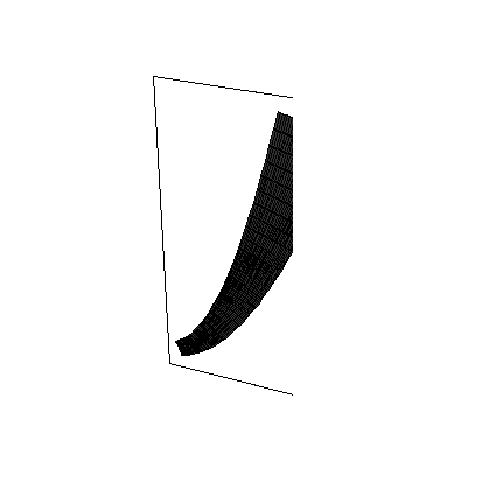
Let's graph ρ=Sin[θ]Cos[φ] (in spherical coordinates):
![]()
![]()
![plotSurface = ParametricPlot3D[Evaluate[CoordinatesToCartesian[{ρ, ϕ, θ}, Spherical]], {ϕ, 0, π}, {θ, 0, 2π}, PlotPoints40]](HTMLFiles/index_149.gif)
![]()
To find the equation of a tangent plane to a surface at a point, remember that if you can express the equation as f[x,y,z]=0, you can find the equation of the tangent plane by setting ∇f[![]() ,
,![]() ,
,![]() ].{x-
].{x-![]() ,y-
,y-![]() ,z-
,z-![]() }=0. (The . stands for the dot product in Mathematica.)
}=0. (The . stands for the dot product in Mathematica.)
So, for example, the above spherical equation could be written as:
![fSpherical[{ρ_, ϕ_, θ_}] := ρ - Sin[θ] Cos[ϕ]](HTMLFiles/index_158.gif)
Converting this in Cartesian coordinates:
![fCartesian[{x_, y_, z_}] = fSpherical[CoordinatesFromCartesian[{x, y, z}, Spherical]]](HTMLFiles/index_160.gif)
![(x^2 + y^2 + z^2)^(1/2) - (z Sin[ArcTan[x, y]])/(x^2 + y^2 + z^2)^(1/2)](HTMLFiles/index_162.gif)
So, to find the tangent plane at a point { ,
,![]() ,
,![]() } (in spherical coordinates), you first have to translate the point in Cartesian:
} (in spherical coordinates), you first have to translate the point in Cartesian:
![ptCartesian = CoordinatesToCartesian[{3^(1/2)/2, π/6, π/2}, Spherical]](HTMLFiles/index_166.gif)
Find the gradient (again, in Cartesian):
![gradfCartesian[{x_, y_, z_}] = Grad[fCartesian[{x, y, z}], Cartesian]](HTMLFiles/index_168.gif)
![{x/(x^2 + y^2 + z^2)^(1/2) + (y z Cos[ArcTan[x, y]])/((x^2 + y^2) (x^2 + y^2 + z^2)^(1/2)) + ... ) + (z^2 Sin[ArcTan[x, y]])/(x^2 + y^2 + z^2)^(3/2) - Sin[ArcTan[x, y]]/(x^2 + y^2 + z^2)^(1/2)}](HTMLFiles/index_169.gif)
It is very important that you use = above and not := or gradCartesian won't work correctly. This is a suble difference between = and :=
= evaluates the right hand side immediately, so it goes ahead and takes the gradient right away (before you plug in any values for x, y, and z.
:= doesn't evaluate the right hand side until later, so the gradient doesn't get computed until after you plug in for x, y, and z, which is a problem since we want to plug in numbers (to evaluate it at a point).
![gradfCartesian[ptCartesian]](HTMLFiles/index_170.gif)
Now find the tangent plane:
![tangentPlane = gradfCartesian[ptCartesian] . ({x, y, z} - ptCartesian)//N//FullSimplify](HTMLFiles/index_172.gif)
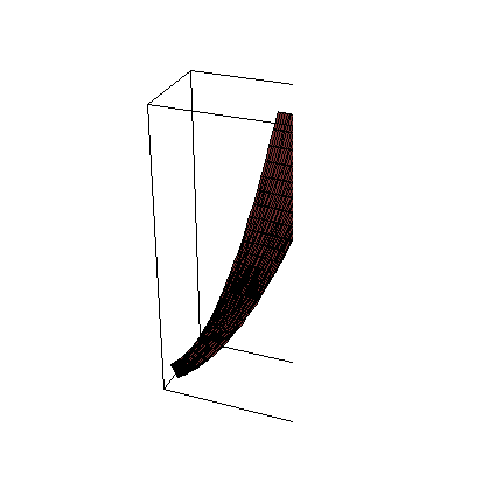
Let's graph this. There are a number of possibilities here. The easiest way is to use ContourPlot3D:
![plotPlane = ContourPlot3D[tangentPlane, {x, -1, 1}, {y, -1, 1}, {z, -1, 1}]](HTMLFiles/index_174.gif)
![]()
So, if this worked, we should be able to display them together:
![Show[plotSurface, plotPlane]](HTMLFiles/index_177.gif)
![]()
Problems
Find equations in Cartesian coordinates for planes through the following sets of points (in the given coordinate systems):
a. {2,![]() ,
,![]() }, {1,
}, {1,![]() ,
,![]() }, {3,
}, {3,![]() ,
,![]() } (points are in spherical)
} (points are in spherical)
b. {1,2,2}, {2,3,5}, {3,6,3} (points are in ParabolicCylindrical)
Graph the following surface:
u=v Cos[φ+v] given in Paraboloidal coordinates
Find the equation for the tangent plane to the above surface at the point {![]() ,
,![]() ,
,![]() } (given in {u,v,φ}).
} (given in {u,v,φ}).
Graph the same equation as above, but this time assume it was given in Toroidal coordinates. (Assume the parameter a=1 in the definition. Warning: you may have to make slight changes in your domain for this to work.)
Warning about Toroidal coordinates in Mathematica: For some reason, Mathematica is inconsistent about its naming convention for the variables in Toroidal coordinates (Help browser says {v,u,φ}, but built-in command refers to {u,v,φ}). It doesn't really matter, but for our purposes, assume it is {u,v,φ}.
Graph the following surface:
{u Cos[v],u Sin[v],![]() } once assuming this is given in Paraboloidal coordinates and a second time assuming it is given in Toroidal coordinates
} once assuming this is given in Paraboloidal coordinates and a second time assuming it is given in Toroidal coordinates
Graph the following curve:
{t Sin[t],t Cos[t],t} once assuming it is given in Paraboloidal and a second time assuming it is given in Toroidal coordinates for 0.5≤t≤π. Find the arc-lenth of this curve over this interval in each coordinate system. Should they be the same? Why or why not? (Hint: use NIntegrate to work the integrals.)
Integration
Path integrals
If you need to integrate a scalar-valued function over a curve, it is pretty straight-forward. For example, to integrate f(x,y,z)=![]()
![]()
![]() over the curve
over the curve ![]() (t)={t,Sin[t],Tan[t]}, 0≤t≤
(t)={t,Sin[t],Tan[t]}, 0≤t≤ ![]() , you need to simply use ArcLengthFactor to convet ds to dt and compose f and c:
, you need to simply use ArcLengthFactor to convet ds to dt and compose f and c:
![f[{x_, y_, z_}] := x^2y^3^z](HTMLFiles/index_195.gif)
![c[t_] := {t, Sin[t], Tan[t]}](HTMLFiles/index_196.gif)
![]()
![]()
![ArcLengthFactor[c[t], t, Cartesian]](HTMLFiles/index_199.gif)
![(1 + Cos[t]^2 + Sec[t]^4)^(1/2)](HTMLFiles/index_200.gif)
![NIntegrate[f[c[t]] ArcLengthFactor[c[t], t, Cartesian], {t, 0, π/4}]](HTMLFiles/index_201.gif)
![]()
If your curve (and function) is in some other coordinate system, you simply have to specify that in the ArcLengthFactor term. (Be careful that you specify your variables in the order Mathematica expects them in for your coordinate system, both in f and in c.)
Problem:
Find ![]()
![]()
![]() ds, where
ds, where ![]() is the curve {
is the curve {![]() ,Sin[t],Cos[t]}, 0≤t≤π, where both the curve and the function are in ParabolicCylindrical coordinates. Graph the curve. Work the problem twice, once in Parabolic Cylindrical coordinates and once by converting everything to Cartesian. Should the answers be the same? (Use NIntegrate to evaulate the integral.)
,Sin[t],Cos[t]}, 0≤t≤π, where both the curve and the function are in ParabolicCylindrical coordinates. Graph the curve. Work the problem twice, once in Parabolic Cylindrical coordinates and once by converting everything to Cartesian. Should the answers be the same? (Use NIntegrate to evaulate the integral.)
Triple integrals
When working a triple integral, you sometimes have to work in alternate coordinate systems. You can use some of the techniques from above to make the computations easier.
For example, if you had to do the following integral:![Underscript[∫∫∫, R]](HTMLFiles/index_208.gif)
![]()
![]() dV, where R is the region defined by R={(r,θ,z}|1≤u≤
dV, where R is the region defined by R={(r,θ,z}|1≤u≤![]() ,2≤v≤3, 0≤φ≤
,2≤v≤3, 0≤φ≤![]() } in Paraboloidal coordinates.
} in Paraboloidal coordinates.
First, let's examine the region by graphing each of the boundaries (this is a pain, but I haven't thought of a faster method yet):
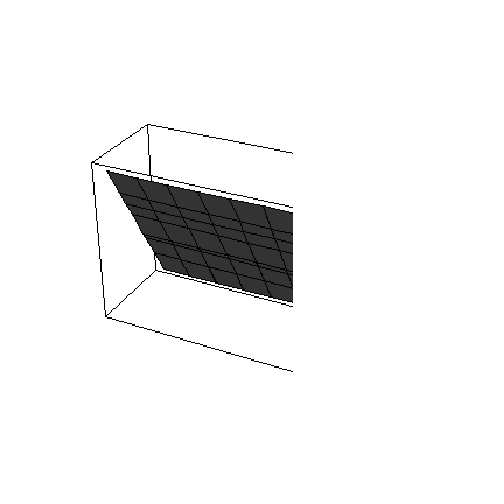
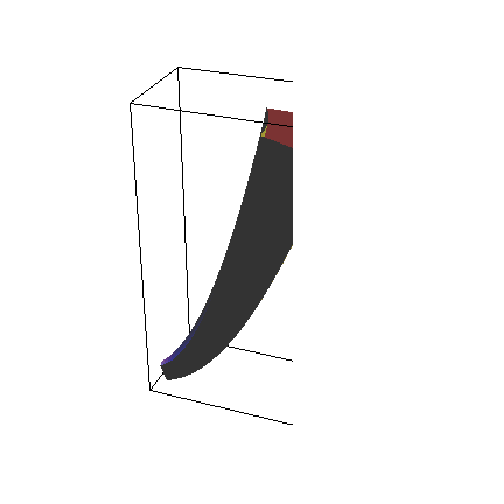
![faceULo = ParametricPlot3D[Evaluate[CoordinatesToCartesian[{1, v, ϕ}, Paraboloidal]], {v, 2, 3}, {ϕ, 0, π/6}]](HTMLFiles/index_213.gif)
![]()
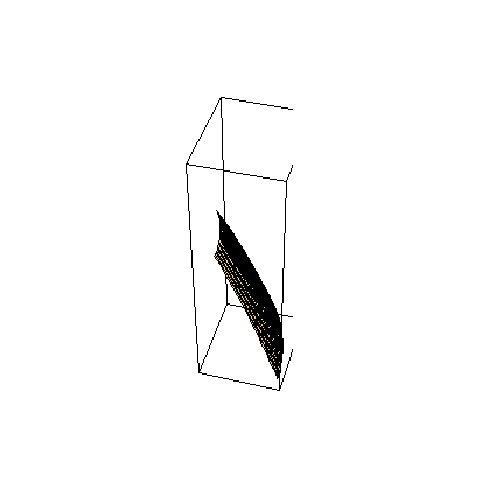
![faceUHi = ParametricPlot3D[Evaluate[CoordinatesToCartesian[{v^2, v, ϕ}, Paraboloidal]], {v, 2, 3}, {ϕ, 0, π/6}]](HTMLFiles/index_216.gif)
![]()
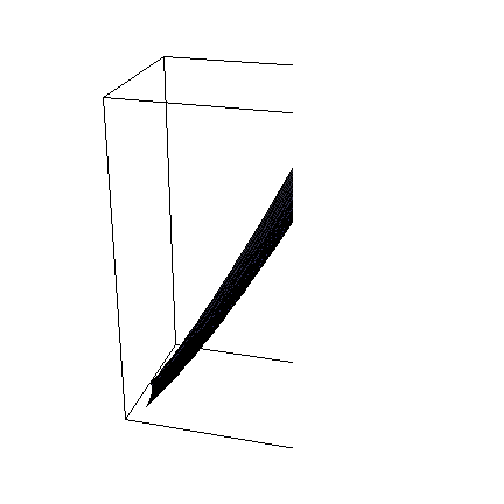
![faceVLo = ParametricPlot3D[Evaluate[CoordinatesToCartesian[{u, 2, ϕ}, Paraboloidal]], {u, 1, 9}, {ϕ, 0, π/6}]](HTMLFiles/index_219.gif)

![]()
![faceVHi = ParametricPlot3D[Evaluate[CoordinatesToCartesian[{u, 3, ϕ}, Paraboloidal]], {u, 1, 9}, {ϕ, 0, π/6}]](HTMLFiles/index_223.gif)

![]()
![faceϕLo = ParametricPlot3D[Evaluate[CoordinatesToCartesian[{u, v, 0}, Paraboloidal]], {u, 1, 9}, {v, 2, 3}]](HTMLFiles/index_227.gif)
![]()
![faceϕHi = ParametricPlot3D[Evaluate[CoordinatesToCartesian[{u, v, π/6}, Paraboloidal]], {u, 1, 9}, {v, 2, 3}]](HTMLFiles/index_230.gif)
![]()
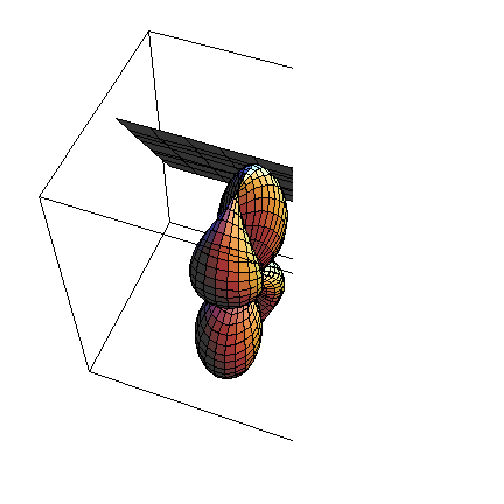
![Show[faceULo, faceUHi, faceVLo, faceVHi, faceϕLo, faceϕHi, MeshFalse]](HTMLFiles/index_233.gif)
![]()
Actually, let's leave off one of the sides (which face is that?):
![Show[faceULo, faceUHi, faceVLo, faceVHi, faceϕHi, MeshFalse]](HTMLFiles/index_236.gif)
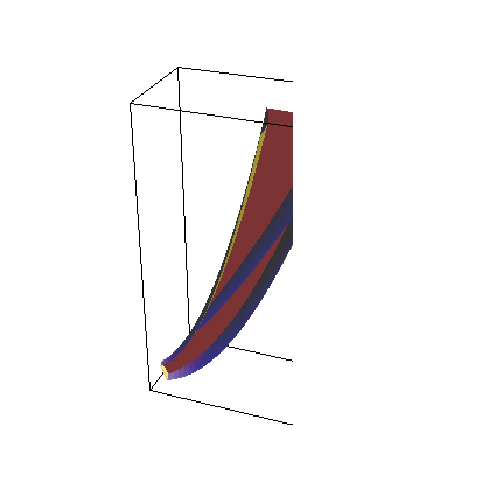
![]()
So, not a great candidate for integration in Cartesian coordinates. (It's the region on the inside.) Let's convert everything into Paraboloidal:
![fCartesian[{x_, y_, z_}] := x^3 (x^2 + y^2)^(1/2)](HTMLFiles/index_239.gif)
![fParaboloidal[{u_, v_, ϕ_}] = fCartesian[CoordinatesToCartesian[{u, v, ϕ}, Paraboloidal[u, v, ϕ]]]//FullSimplify](HTMLFiles/index_240.gif)
![u v (u^2 v^2)^(3/2) Cos[ϕ]^3](HTMLFiles/index_242.gif)
![jDet = JacobianDeterminant[Paraboloidal[u, v, ϕ]]](HTMLFiles/index_243.gif)

![]()
![∫_0^(π/6) ∫_2^3∫_1^v^2fParaboloidal[{u, v, ϕ}] jDetuvϕ](HTMLFiles/index_246.gif)
![]()
Problem:
Find ![Underscript[∫∫∫, R]](HTMLFiles/index_248.gif)
![]()
![]() dV, where R is the region defined by R={(r,θ,z}|0≤u≤1,2≤v≤
dV, where R is the region defined by R={(r,θ,z}|0≤u≤1,2≤v≤![]() +3, 0≤z≤u v} in ParabolicCylindrical coordinates. Graph the region of integration.
+3, 0≤z≤u v} in ParabolicCylindrical coordinates. Graph the region of integration.
| Created by Mathematica (March 20, 2005) |