PHYS 1401 –
General Physics I
Boyle’s Law
Leader: ____________________ Reporter: ___________________________
Skeptic: ___________________ Encourager: _________________________
Materials
LabPro
Laptop
Pressure Sensor with Syringe
Digital Caliper
Introduction
In this lab we will investigate one of the
gas laws, namely Boyle’s Law. Boyle’s
law relates the pressure and volume of a gas.
Procedure
We want to have a known volume of air in
this experiment. The volume we will use
will consist of two pieces. The first
part of the volume is from the syringe and the second part is from the tube
connecting the syringe to the gas pressure sensor (PS).
The contribution to the volume of air in
the system from the plastic tubing will remain constant. To determine the contribution, we will
calculate the interior volume of the tube.
Q1. If you straighten the tube out, what is the
shape of the volume interior to the tube?
Q2.What measurements do you need to determine the
volume? Make these measurements and calculate the
volume of the interior of the tube in units of cm3.
Note: The volume of the interior of the tube
connecting the syringe to the pressure sensor is a fraction of a cm3. If you got an appreciably bigger number,
check your measurements and calculation.
We
will read the volume for the syringe from the syringe, directly.
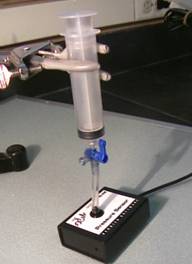
1. Setup
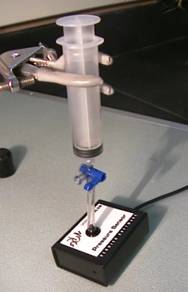
To set up the experiment, connect the plastic tube from the pressure sensor (PS) to the tip of the syringe as shown in figure 1. Position the valve on the PS so that it is open to atmosphere as shown in figure 1. This will make the pressure inside the syringe the same as that of the atmosphere. Pull the syringe so that the tip sits at the 20 cm mark. Then position the valve on the PS so that it reads the pressure inside the syringe as shown in figure 2. Connect the PS to CH 1 on the LabPro. Start LoggerPro and open the experiment file by following the path Probes & Sensors=>Pressure Sensors=>Pressure Sensor=>Boyle’s Law-PS. When you open LoggerPro a box will appear asking you to confirm the sensor. Click OK to proceed.
Figure
1 Position of valve so that syringe is open to the atmosphere
Figure
2 Position of valve when taking data
2. Data Acquisition
Click on the Collect button to start
acquiring data. The LabPro will read the
pressure continuously until you click on the Keep button. Once you click on the keep button the
pressure will be recorded and a box will appear. Record the volume of the syringe plus the
tube in ml in the box that appears. (Note
1 cm3 = 1 ml)
Now decrease the volume in the syringe to
17.5 cm3, and repeat the data acquisition procedure. Click on the Keep button when you are holding
the syringe steadily at 17.5 cm3.
Repeat this procedure each time decreasing the volume by 2.5 cm3,
until you reach a volume of 5 cm3.
Note: Don't go beyond 5 cm3
as this can damage the pressure sensor.
Data
Analysis and Questions
We now wish to analyze our data. Examine your graph of Pressure vs. Volume in
LoggerPro.
Q3) Do your
data appear to lie on a straight line?
Q4) Add a best fit line through your data. Do you see any systematic trends in the
data?
Q5) May some
other type of curve fit the data better?
It turns out that the answer to the last
question is yes. Let us try and
determine what type of curve will fit the data better. Our first volume was
approximately 20 cm3 with its corresponding pressure. A later data point had a volume of
approximately 10 cm3 with the corresponding pressure. Note here that the 10 cm3 volume is
approximately 1/2 of the 20 cm3 volume.
Q6) Find the corresponding ratio of the pressures
for these two volumes?
Compare
the original volume the volume of approximately 5 cm3. Here the volume is 1/4 as much as the initial
volume.
Q7) What is the ratio of
the pressure at this volume to the initial pressure?
Q8) Does there seem to be some kind of
relationship between the ratio of volumes and the corresponding ratio of
pressures? Describe the type of
relationship.
You should have noticed that the ratios of
the pressures and of the volumes are the reciprocals of each other. This is the essence of Boyle’s law. Boyle’s law states that if the temperature
and the amount of gas are held constant, that the pressure is inversely
proportional to the volume.
This suggests to us a way that we should analyze
our data to see the relationship between the points in a clear way. Click on the curve fit button ![]() in LoggerPro.
In the box that appears scroll down to the option Inverse A/x and click on the radio
button. Click on the Try Fit button and
then click on OK. Print a copy of the
graph and attach it to the report.
in LoggerPro.
In the box that appears scroll down to the option Inverse A/x and click on the radio
button. Click on the Try Fit button and
then click on OK. Print a copy of the
graph and attach it to the report.
Q9) Does the
inverse relationship seem to fit the data well? Explain.
Q10) Record the value of A given by the fit for
later reference. A is the proportionality constant between P and 1/V.
The Dependence of the proportionality constant on the
amount of gas
Open the valve on the pressure sensor so
that the syringe is open to atmosphere as shown in figure 1. Move the syringe at the 10 cm3
mark and position the valve again so that it reads the pressure in the syringe
as shown in figure 2. Collect Pressure
vs. volume data as before except take into account your answer to the next
question (Q11).
Q11) What about your
procedure do you need to modify, so that you end up with a total of six data
points ending at a volume of 5 cm3?
Once
you’ve collected your new set of data, fit an Inverse A/x relationship to it
like you did for the first graph. Print
and attach the graph to the report.
Q12) Record the value of A given by the fit.
Q13) How does the value
of A determined for the second set of data compare to the value determined from
the first set of data?
It
should be about 1/2. When you opened the
valve you let air escape, thus the amount of air is less than when you started
the syringe at 20 cm3.
Q14) If air has a
constant density, by what factor is the amount of air reduced when the volume
is reduced by half?
Q15) How does this factor
compare to the reduction in the value of A determined from your two
experiments?
Q16) Based on these
observations, what do you think is the relationship between the value of A and
the amount of gas in the syringe?
Q17) Devise an experiment to test your answer to
question 16. Describe your procedure. Be specific about details such as starting
point, number of data points, changes between
successive data points and so on.
P18) Make a specific prediction about the value of
A which will be found when you conduct your new procedure.
Q19) Carry out your experiment and record the
results below. Print and attach the
graph.
Q20) Was your prediction
correct?
Q21). Summarize the experiment by completing the
following with the appropriate type of mathematical relationship. If the amount of gas and temperature are held
constant, Pressure is ________ to Volume.
The proportionality constant of Pressure vs. 1/V is ___________ to the
amount of gas.