PHYS 1401 –
General Physics I
Leader: _____________________________ Recorder: ___________________________
Skeptic: _____________________________ Encourager:
_________________________
Introduction
In
this activity, we will explore
Materials
Pasco
Cart with WDSS attached Laptop with Blue Tooth dongle
String Motion Detector (Top Drawer)
Procedure
1. Set-up
Position the Pasco Dynamics track so that the pulley attached to one end of the track will be suspended over the end of the table. Level the track by adjusting the feet on the bottom. The cart should remain stationary when placed on the track. Connect the LabPro to the computer and connect the Motion detector to DIG/SONIC 1 on the LabPro. Start LoggerPro and click on the open icon. Double click on the Probes & Sensors folder, then double click on the Motion detector folder. Double click on the file title Motion Detector.
2. Set-up the Force Probe
Turn on the Wireless force probe. In LoggerPro click on the Experiment menu, then click on Connect Interface, then click on Wireless and then click on Scan for Wireless Devices. LoggerPro will think for a minute or two and then give you a message box saying it couldn’t find any devices. Click on Yes to scan again and after a little bit, LoggerPro should give a list of the wireless sensors it found. Make sure that the box is checked that matches the name on your sensor, and no other. If you don’t get the list of available sensors at this point contact your instructor. Make sure that the small eye hook is screwed into the force probe on the sensor.
3. Set up the cart
If not already attached, attach the force sensor to the top of the cart and then use the electronic balance to measure the mass of the cart (plus sensor) and record the value. Place the cart upside down on the scale while weighing so that it does not role off.
mass of cart = ___________ kg
Obtain a piece of string approximately 1.0 m in length and tie one end to the hook on the force sensor and tie the other end around the mass hanger.
Place the motion detector on the track at the side opposite the pulley. Position the detector so that it faces the cart and make sure that the switch on the motion detector is in the cart position. The cart has to be at least 15 cm from the motion detector. You might find it helpful in acquiring data to angle the detector slightly up so that it detects the cart over the maximum range possible as opposed to detecting the track. Experiment with the angle the detector points by pointing it and then letting the cart move away form the detector while collecting data. Adjust the detector so that it “sees” the cart over as much of its motion as possible.
Attach the string to the cart and the other end to the 5 g plastic mass hanger. Place a 10 g mass on the hanger.
3. Zero the Force Sensor
We
want the force sensor to read 0 when the cart is sitting horizontally on the
track with no tension in the string.
Place the cart horizontally on the track and make sure that the string is slack. Click on the Experiment menu and then choose Zero…
A window will appear. Click OK in the
window and after a few seconds, the force sensor will be ready to go. Before
every data run, you should zero the force probe.
Data Analysis and Questions
Position the cart so that the rear of the cart is 50 cm in front of the motion detector. Click on the collect button and once the motion detector starts clicking release the cart.
1. Once the cart starts moving, sketch the appearance of the velocity vs. time graph. Focus on the appearance of the graph while the cart is moving, not the extraneous details about the cart starting, stopping, bouncing at the end, and so on.
2. What does the corresponding part of the acceleration vs. time graph look like in this case?
3. Did a constant acceleration produce a linearly increasing velocity?
4. What does the corresponding part of the graph of force vs. time look like?
5. Did a constant force produce a constant acceleration?
6. Click on the acceleration graph. Click and drag over the data in the region where the cart was accelerating. Click on the button which says STAT. This will give you among other information, the average (mean) acceleration. Record in the data table below.
7. Click on the force graph. Click and drag over the data in the region where the cart was accelerating. Click on the button which says STAT. This will give you among other information, the average (mean) force. Record in the data table below.
|
Total Mass on Hanger (g) |
Acceleration (m/s/s) |
Force (N) |
|
15 |
|
|
|
25 |
|
|
|
35 |
|
|
|
45 |
|
|
|
55 |
|
|
Add 10 g to the hanger so that the total mass on the hanger is 25 and repeat the procedure. Record the measured value of force and acceleration. Repeat three more times adding 10 g to the hanger each time. Note that you need to close the statistics and linear fit boxes and choose a new area each time you take data.
8. Each time you added 10 g to the mass hanger, what happened to the force that you measured?
9. Each time that you added 10 g to the hanger, what happened to the acceleration that you measured?
10. Does there seem to be a relationship between the force and the acceleration? If so what type?
11. What should a graph of Force vs. acceleration look like, if your answer to question 10 is correct?
12.
Gently disconnect the USB cable from the back of the laptop. Click on the New icon ![]() and LoggerPro will give you a window where you
can enter the data from your data table.
Construct a correctly labeled graph of Force vs. Acceleration. Add a best fit line to your graph by click on
the following icon
and LoggerPro will give you a window where you
can enter the data from your data table.
Construct a correctly labeled graph of Force vs. Acceleration. Add a best fit line to your graph by click on
the following icon ![]()
13. Record the slope of the line of the best fit line including units.
Slope = ________________
14. Use that a newton is expressed in fundamental units as kg m/s/s and reduce the units of the slope to lowest terms. What physical quantity has these units? _________
15. The slope of the line then represents the ____________ of the cart. How does the value you determined from the slope compare to the value you measured directly?
16. Discuss what sources of error might result in the values not agreeing.
17. List the forces that act on the cart.
18. Draw a properly labeled free body diagram for the cart.
19. Which of the forces that you listed did you measure with the force probe? Explain.
20. Does the force probe measure the net force on the cart? Explain
21. It turns out that the y-intercept of the graph gives the frictional force acting on the cart. If you subtract the constant friction force from your data, what will your graph look like?
22. We can use LoggerPro to carry out the subtraction. Click on Data and then choose New Calculated Column… The following window will appear
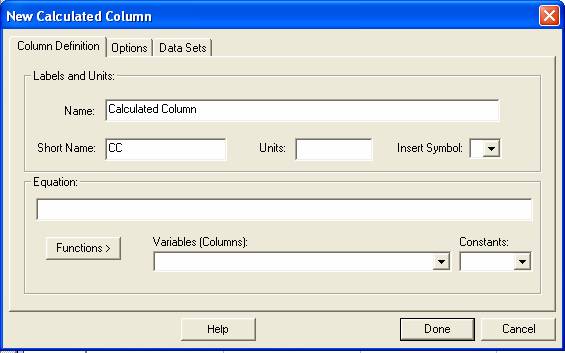
Name the new column Net Force and give it appropriate units. Click in the Equation box and then choose the name you entered for the Force column from the Variables (Columns): list. Enter – and then the value of the y-intercept of your previous graph and click Done. Click on the y-label of the graph and uncheck the current column and check the net force column. You should now have a graph displayed of Net Force vs. Acceleration.
23. What kind of relationship is shown between the net force on the cart and the acceleration of the cart?
24. Add a best fit line to this graph. Is the slope different than before?