Safety
Safety Glasses are available and their use is required
for this activity.
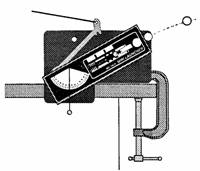
Typical Set-up
Introduction
When
a projectile is fired, the horizontal distance traveled or “range” depends on
the angle at which the projectile is launched.
In this activity we will experimentally determine the angle which maximizes
the range for two cases. In one case we
will explore where the launch and landing occur at the same elevation. Then we will explore the case where the
launch and landing are at different elevations.
Procedure
Part 1 Launch
and Landing at Same Heights
1. Set-up
Put
on your safety glasses. Clamp the
projectile launcher to the table at one end so that the launcher faces into the
table. Adjust the height of the launcher
so that you can rotate it through and angle from 10° to 70° without having to
change the height of the launcher.
Adjust the height of the lab jack so that it is the same as the bottom
of the point from which the ball is released.
When
you load the ball into the launcher, there are three different positions it can
lock into. For this part always use the
first position so that the ball will land on the table.
2.
Data Acquisition
Load
the ball so that the launcher clicks once.
Pull the cord to release the ball and observe where it lands. Position the lab jack with the white paper taped
on top and the carbon paper facing down.
When the ball lands it will make a mark on the paper. Measure the distance from the launch point to
the landing point and record your data in the table below. Change the launch angles in 10° increments up
to 70° and measure the range in the same way.
Do not disassemble the apparatus yet.
Data Table for Part 1
|
Launch
Angle |
10° |
20° |
30° |
40° |
50° |
60° |
70° |
|
Measured
Range (cm) |
|
|
|
|
|
|
|
Analysis for
Part 1
Use
Excel or LoggerPro 3.1 to construct a properly labeled graph of Range vs.
Launch Angle. If you need help with the
software, contact your instructor. When
we say Range vs. Launch Angle, range should be on the y-axis and angle on the
x-axis. Remember a properly drawn graph
should have the following features
i.
A descriptive title
ii.
Each axis labeled with the quantity it represents. The units of measure should be included in
parentheses following the label.
iii.
Each axis should have tick marks with values labeled
iv.
The data should fill the graph appropriately
Print and attach a copy of your graph.
Q1)
Use your graph to estimate the angle at which the range is maximum.
Record the angle ______
and the maximum Range ________
Q2)
Position the launcher at the angle you estimated the range will be
maximum and then measure the range in the same way.
Q3)
How close was your estimate to the measured value of the range? Compare the two by computing the % difference
between them.
Q4)
You probably estimated that the range should be maximum for an angle
near 45°. Do you think this will be the
case even if the launch and landing heights are different?
Part 2 Launch
and Landing at Different Heights
1.
Set-up
In
part 2 we will use basically the same procedure as in part 1 with two
modifications. We will let the ball land
on the floor so the launch and landing heights are different. Aim the plumb bob
so that it has a clear spot to land on the floor. Make sure that the launcher can be aimed from
10° to 70° without changing the height. Use
a plumb bob (or meter stick) to mark a point directly below the launch point.
You will use this point as the reference point to measure the distance x
where the ball falls.
2. Data Acquistiion
With
ball in the launcher, release the ball once to find where to place a sheet of
white paper. Then, place carbon paper on
top of the sheet of white paper with the carbon face down.
Measure
the horizontal distance x that the ball traveled. Repeat the measurement for increments of 10°
up to 70° and record your data in the table below.
Data Table for Part 2
|
Launch
Angle |
10° |
20° |
30° |
40° |
50° |
60° |
70° |
|
Measured
Range (cm) |
|
|
|
|
|
|
|
Analysis for
Part 2
Use
Excel or LoggerPro 3.1 to construct a properly labeled graph of Range vs.
Launch Angle.
Print and attach a copy of your graph.
Q5)
Use your graph to estimate the angle at which the range is maximum.
Record the angle ______
and the maximum Range ________
Q6)
Position the launcher at the angle you estimated the range will be
maximum and then measure the range in the same way.
Q7)
How close was your estimate to the measured value of the range? Compare the two by computing the % difference
between them.
Q8) Is the angle yielding the maximum range of
projectile the same when the launch and landing heights are different as when
the launch and landing heights are the same?
Q9) How does the angle compare for the second
case compared to the first? (I.e.greater, less, the same)
Q10) Do you think a shot putter would like to
throw the shot at an angle of 45° or an angle different than 45°? If a different angle, the should the angle be
greater than 45° or less? Use the
results of this experiment to justify your answer.