PHYS 1401 – General Physics I
Introduction to Waves
Leader: _____________________________ Recorder: ___________________________
Skeptic: _____________________________
Encourager: _________________________
Materials
Slinky Metric
Tape Measure
Stop Watch Ring
Stand with jaw clamp
Spring Scale (5 N capacity) LabPro
ULI Microphone Laptop
2 m cardboard tube Masking
Tape
Ring Stand Table
clamp with pulley
mass hanger with 100 g mass Mechanical
wave driver
Frequency generator with appropriate cabling
Part
1: Types of Waves and the Definition of
a Wave
Stretch the slinky a distance of several meters on the floor. Shake the slinky sharply to the right or left one time. In so doing you will produce a wave pulse.
1) Sketch the resulting behavior of the slinky.
2) Is there a net motion of the slinky?
The first type of pulse you launched was called a transverse pulse.
3) Explain the relationship between the direction the wave traveled and the direction of the disturbance in a transverse wave.
Sharply push the slinky inwards one time.
4) Sketch the behavior of the slinky.
5) Is there a net motion of the slinky?
The second type of pulse you launched is called a longitudinal pulse.
6) Explain the relationship between the direction the wave traveled and the direction of the disturbance in a longitudinal wave.
7) If there is no net motion of the slinky, what does move when a wave travels along a slinky? Explain.
The slinky is called the medium through which the wave moves, and what moves through the medium is called a disturbance.
Place a light object like an empty soda can near one end of the slinky. Create a transverse wave pulse by sharply shaking the slinky one time to the side.
8) Were you able to move the light object? (If not, position the object closer to the slinky and try again.)
9) If the light object was initially at rest, and then began moving it gained kinetic energy. Where did this energy come from? Does a wave carry energy?
With this series of observations, you have seen the basic behavior of all waves. Since there is not net motion of the slinky, we refer to the slinky as having been disturbed from its rest, or equilibrium position.
10) Complete the following: A wave is a motion of a __________ through a ________ which can transport ________________.
Now, shake the slinky continuously back and forth.
11) Sketch how the slinky appears.
When you generate a wave continuously as you just did, it is called a wave train or else a continuous wave.
12) Was the wave train you created transverse or longitudinal?
13) Describe how you can move the slinky so that you produce a longitudinal wave train.
14) Carry out the procedure you described in 13) and sketch your results below.
15) Sketch a transverse continuous wave in the space below.
16) Sketch a longitudinal continuous wave in the space below.
Part
2: Speed of Waves
In part 2 of this activity, we will explore the dependence of the speed of a mechanical wave on a slinky on the tension in the slinky and the linear mass density of the slinky. We will make use of traveling waves like those we made in part 1. Traveling waves travel down the length of the slinky. In part 4 of this activity we will investigate another type of wave called a standing wave.
First determine the mass of the slinky.
1) m =
Now stretch the slinky on the floor a distance of 4 m. Have a person holding the slinky tightly at either end.
2) Record the length of the slinky
L =
3) What is the mass per length (or the linear mass density) of the slinky?
m =![]() =
=
Launch a single transverse pulse of the slinky and record the round trip time of the pulse. To obtain better data, repeat the measurement 10 times and find the average of your round trip times.
Trial Value
1.
2.
3.
4.
5.
6.
7.
8.
9.
10.
4) Record the average round trip time
t =
5) What was the speed of the wave on the slinky?
![]() =
=
6) Why is there a factor of two in the previous formula?
With the slinky stretched in the same way over the same distance, support one end of the slinky with the spring scale.
7) Record the tension in the slinky. Remember, the tension is a force, so use the correct scale on the spring scale.
T =
The theoretical prediction for the
speed of the wave on the slinky is given by
![]()
8) Calculate the theoretical prediction for the speed of the wave on the slinky
v =
9) How do your values compare?
Part 3: The Speed of Sound in Air
We can use a very similar idea
to the one we just used to measure the speed of sound in air. We will measure the time it takes a sound
wave to travel round trip in a tube of air.
Knowing the length of the tube, we can determine the speed of sound in
air.
Procedure
1. Set-up
Measure and record the length
of the tube.
Tube Length = _____________
Clamp the microphone in the jaw clamp.
Connect the microphone to CH1 on the LabPro and connect the LabPro to
the computer with the USB cable.
Position the microphone so that it is at the opening on one end of the
tube without touching the tube.
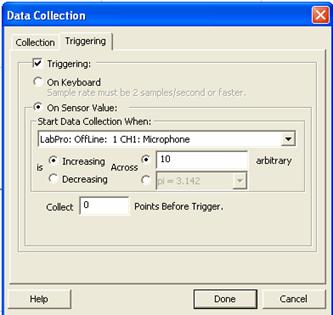
2. Start LoggerPro and open the
experiment file “Probes &
Sensors”=>”Microphone”=>”Microphone.cmbl”. Click on the data collection button ![]() , click on the
Triggering tab on the box that opens, and check the box labeled
Triggering. Once you have checked, the
Triggering box, change the value of 10 to a value of .05.
, click on the
Triggering tab on the box that opens, and check the box labeled
Triggering. Once you have checked, the
Triggering box, change the value of 10 to a value of .05.
Zero the microphone by pressing the Zero button.
3. Data Collection
Click on the collect button and the snap your fingers sharply at the
opening on one side of the tube. The
computer should display a graph which has several groups of sharp peaks. Each group of peaks corresponds to an echo of
the snap reaching the microphone, thus the distance between the peaks
represents the time it takes the sound to make a round trip in the tube. If
snapping your fingers doesn’t work, you can try clapping cupped hands
together. If LoggerPro doesn’t trigger
data collection when you clap, contact your instructor.
1) Use the examine button ![]() to determine the round trip time of the sound
in the tube.
to determine the round trip time of the sound
in the tube.
T = ________________
2) From your measured values for
tube length and round trip time, determine the speed of sound in air. Show your work in the provided space.
3) The accepted value of the speed
of sound depends on temperature but is usually about 340 m/s. How does the value you determined compare to
the accepted value. Discuss the
difficulties you had and any sources of error in determining the speed of sound
using this method.
Part 4: Reflection and Interference of Waves
In this part of the lab we will investigate properties that all waves share. These include interference, diffraction, reflection and refraction. One of the most important conditions that affect wave motion is what is happening at the end of the medium in which the wave moves. The conditions at the end are called the boundary conditions. A wave will always reflect whenever it encounters a boundary, and we will now investigate how the boundary conditions affect the reflection.
Reflection
Hold the slinky at both ends. Launch a single transverse pulse from one side and carefully observe how it appears after it is reflected.
1) Sketch a diagram showing how the wave pulse looked before and after the reflection.
Now hold on one end of the slinky with a ring stand so that the slinky is free to slide horizontally on the ring stand. Launch a single transverse pulse and carefully observe how it appears after it is reflected. Note be patient with this step. It can be difficult to see at first.
2) Sketch a diagram showing how the wave pulse looked before and after the reflection.
3) Compare the orientations of the reflected pulses to the incoming pulses for questions 1).
4) Compare the orientations of the reflected pulses to the incoming pulses for questions 2).
There are two distinct ways that a wave can reflect at a boundary. One way is that the reflected wave is on the same side as the incoming wave. In this case, the reflected wave is in phase with the incident wave.
5) Did this occur for question 1) or 2)?
The second way is that the reflected wave is on the opposite side as the incoming wave. In this case, the reflected wave is 180° out of phase with the incident wave.
6) Did this occur for question 1) or 2)?
In question 1) we held the position of the slinky fixed. This is sometimes referred to as a high impedance boundary condition.
7) Describe the phase of the reflected wave compared to the incident wave at a fixed boundary condition.
In question 2) we allowed the end of the slinky at the reflected end to move freely. This is sometimes referred to as a low impedance boundary condition.
8) Describe the phase of the reflected wave compared to the incident wave at a free boundary condition.
Interference
Launch single transverse pulses simultaneously and on the same side from each end of the slinky. Observe what happens to the pulses when they meet in the middle. To help you see what's going on, place a small object near the middle of the slinky where the pulses meet.
1) Sketch a diagram showing what happens to the pulses when they meet in the middle.
2) Do the pulses stop when they meet or do they continue moving?
The adding together of the two pulses in the middle is an example of what is called linear superposition. When waves overlap, they simply add together. Linear superposition is also called interference. If the waves reinforce each other as in this case, we call the interference constructive.
3) Were the two pulses in phase or 180° out of phase?
4) Complete the following. Constructive interference occurs when the waves are ________ phase.
Launch single transverse pulses simultaneously and on opposite sides from each end of the slinky. Observe what happens to the pulses when the meet in the middle.
5) Sketch a diagram showing what happens to the pulses when they meet in the middle.
6) Do the pulses stop when they meet or do they continue moving?
If the waves cancel each other as in this case, we call the interference destructive.
7) Were the two pulses in phase or 180° out of phase?
8) Complete the following. Destructive interference occurs when the waves are ________ phase.
Part 5: Standing Waves
In this portion of the lab, we will examine a type of wave called a standing wave. We will determine the wavelength and the frequency of different standing waves and construct a graph to examine any relationship between the frequency and the wavelength of the standing waves. A standing wave is a wave that oscillates in time only but does not propagate like a traveling wave does. Figure 1 shows some envelopes – the limits between which the standing waves vibrate - of standing wave patterns. The wavelength of the each standing wave pattern is related to the length. In the first pattern, half of a wavelength fills the length L. In symbols λ/2 = L, so λ = 2L. Figure 1 also depicts the nodes, the points which don't move, for each standing wave. It can be easier to identify a particular standing wave pattern by looking at the number of nodes. In each successive standing wave pattern, one more node occurs.
Figure 1 The first two envelopes (boundaries) between which standing wave patterns oscillate
9) In the second standing wave pattern shown in figure 1, how many wavelengths occur in the distance L? Use this to find the wavelength for the second pattern.
10) How many nodes should the next pattern have? Sketch how the next pattern should appear.
11) Determine the wavelength for the standing wave pattern you have just drawn.
Again stretch the slinky to a length of 2 m for short slinkies and 4 m for long ones. Hold one end of the slinky fixed and shake the slinky until the first pattern shown in figure 1 appears. Note this will only happen at a specific frequency.
12) Determine the frequency at which the slinky is being shaken. Accomplish this by timing 10 complete oscillations. The frequency will be given by f = 10/T
T =
f = 10/T =
What is the wavelength for this standing wave?
l =
Record your result in the table given below.
Repeat the measurement for the next two standing wave patterns, i.e. with 1 node and then with 2 nodes.
Trial Time for 10 oscillations (t) Frequency
(f=10/t) Nodes (n) Wavelength (l)
1.
2.
3.
13) Did the wavelength of the waves increase or decrease as you found standing wave patterns at higher frequencies?
14) What type of relationship does this suggest between the wavelength and the frequency of the standing waves?
We will now use a different apparatus to examine this relationship more accurately. Connect a cord to the Mechanical Wave Driver (MWD), run the cord over a pulley and suspend a 100 g mass hanger from the other end.
Arrange the apparatus so that distance from the MWD to the pulley is about 1 m.
15) Record the length between the pulley and the MWD.
Connect the output of the function generator to the MWD. Place the multiplier switch in the 10 position and turn the amplitude all the way down (fully counter clockwise). Turn the amplitude slowly up until the MWD is oscillating several cm up and down. Adjust the frequency of the oscillator until you generate the first standing wave pattern shown in figure 1. Record the frequency of the standing wave and the wavelength in the table below.. Repeat for four more standing wave patterns. Note you may need to change the multiplier setting to find all five patterns.
Trial Frequency Nodes
(n) Wavelength (l)
1.
2.
3.
4.
5.
16) In question 14 you suggested what type of relationship may be demonstrated by the data. What variable would you graph frequency vs. to demonstrate that type of relationship?
17) Use whatever software you want to construct a graph of the frequency versus the reciprocal of the wavelength, f vs. 1/l. (Remember, it is y vs. x) Add the best fit line that goes through your data. Be sure to include the equation of the line on your chart. Record the equation of the chart below.
18) What are the units of the slope? What type of physical quantity has these units?
19) Does the best fit line go through the origin or at least very close?
20) Use your result of question 18) to find a relationship between the frequency and the wavelength and record the relationship in the space below.
21) What is the speed of waves on the string?