PHYS 1402 – General Physics II
Resistance and Ohm’s Law
Leader: _____________________________ Recorder:
___________________________
Skeptic: _____________________________ Encourager:
_________________________
Introduction
In
this lab, we will investigate the relationship between current and
resistance. for
ordinary conductors, we will find that the two are proportional – a result
known as Ohm’s Law. Ohm’s Law is named
for its discoverer Georg Simon Ohm, a German
physicist, who
found it experimentally in the early 19th century. Ohm’s Law is not a law in the sense of
Part 1 Current
You are given a battery, a single piece of wire and a low voltage light bulb. Find a way to make the light bulb light.
Q1) Sketch the arrangement that made the light bulb light.
Q2) Find three other geometric arrangements of bulb, battery, and wire that will make the light bulb light and sketch each of them in the space below.
Q3) When the light bulb is lit, a current is flowing through it. What condition must be met so that a current flows?
Q4) Explain
how your condition is met in this case.
Part 2 Resistance
First let us review a result we had in the a previous lab we conducted about potential difference.
Q5) When we connected batteries in series, we found that the potential difference of the batteries in series __________
Q6) When we more batteries in series connected across a light bulb, the light bulb was ______ than if connected across a single battery.
Now, connect a single light bulb in a socket across the Genecon. Turn the Genecon at a rate of about 1 turn per second and observe the brightness of the light bulb and the effort to turn the Genecon.
Next, Use the alligator clip cables to connect two light bulbs in series across the Genecon. Turn the Genecon at a rate of about 1 turn per second.
Q7) Compare the effort required to turn the Genecon now at 1 turn per second to when it was connected across a single light bulb.
Q8) How bright are the light bulbs now compared to before?
Q9) If the brightness of the light bulbs is a measure of the current flowing in the circuit, compare the current flowing in the circuit now compared to when only a single light bulb was connected across the Genecon.
The property of a material which limits current flow through it is called resistance. The greater the resistance of a material, the less current will flow in it.
Q10) When you connect light bulbs in series, is the resistance greater, the same, or less than an individual light bulb. Explain your answer.
We can make a circuit schematic to show the circuit we are making. We use a symbol
![]()
like to represent a battery or some other source of potential
difference like a Genecon or power supply
![]()
and we use to represent a light bulb or a resistor in general. The conducting connections between elements like resistors and batteries we show as straight lines.
Q11) Use the symbols just described to draw a circuit schematic for i) the Genecon connected to one light bulb and ii) the Genecon connected to two light bulbs in series.
We begin to see a by now fairly familiar type of relationship. The more batteries in series, the brighter the bulb (the more current). The more bulbs in series, the dimmer the bulbs (less current). Batteries are sources of what is called potential difference. The relationship between current, potential difference, and resistance is called Ohm’s Law, and after familiarizing ourselves with the correct use of voltmeters and ammeters, we will explore Ohm’s Law.
Part
3 Use of
Voltmeters and Ammeters
In
the following procedure, disconnect your circuits when not making observations
to preserve battery life.
Use
the

Observe the bright ness of
the light bulbs.
When we picture a meter on a schematic we show it by a
circle with a letter inside designating the type of meter. Thus a voltmeter will be a circle with a V
inside and an ammeter will be a circle with an A inside. Potential differences are measured across
objects so when using a voltmeter – or a DMM in voltmeter setting – we place
the probes on either side of the object.
Make sure that the voltmeter
Q12) Use the DMM to measure the potential
difference across each resistor and record the values (both values should be
positive) V1
= ________ V2 = __________
Q13) Find the sum of the potential differences
V = V1 + V2
= _______
Q14) Find the potential difference across both
resistors and record
V = ________
Q15) How does your answer to Q14) compare to Q13)? Explain why this should be the case.
Q16) Measure the potential difference across the
battery and record
V = _______
Q17) How does your answer to Q16) compare to Q13)? Explain why this should be the case.
Now we will find out what
happens when we connect a voltmeter incorrectly. Instead of using the voltmeter across a resistor,
let us connect it in series with the circuit.
Connect the following circuit. Note to put a new element in series, you
must make a break in the current circuit.

Q18) What happens to the
light bulbs when you place the voltmeter in series with the circuit?
Q19) Does this suggest that a voltmeter has a high
resistance or a low resistance? Explain.
Now we will examine using an ammeter.
Current flows through a circuit so to measure it, the current must flow
through the ammeter. Thus when we use an
ammeter correctly it must be placed in series in the circuit.
Remove the voltmeter from the circuit and
reconnect the battery across the two light bulbs in series. Take a piece of alligator clip wire and short
out one of the light bulbs by connecting the wire form one side of the socket
to the other.
Q20) What happens to the
other light bulb?
Q21) Did the current
increase or decrease when the first light bulb was shorted out?
This is
why short circuits are so dangerous.
When resistors are shorted out, current can increase by a large amount
and this can release a lot of heat and pose a fire danger.
Disconnect
the short circuit.
Now we
will use an ammeter incorrectly and see what happens. It is very common for people to connect an
ammeter like it was a voltmeter, namely to connect it across a circuit element
instead of putting it in series with the circuit. Clip one alligator clip lead onto the black
common terminal on the ammeter and the other onto the 5 A
terminal. This means that the ammeter
will read 0 – 5 A. If the lead was
connected to the 500 mA terminal it would read 0 –
500 mA and so on.
Connect the ammeter across one of the light bulbs and observe what
happens. Disconnect once you have made
your observation.
Q22) Describe what happens. Did you short out the light bulb?
When you
connect an ammeter across a circuit element, you create a short circuit and
increase the current in the circuit. This
can be dangerous and at the very least can damage the ammeter. Ammeter must be connected in series with the
circuit.
Connect
the ammeter in series with the light bulbs between the positive terminal of the
battery and the first light bulb.
Q23) Are both light bulbs now lit?
Q24) Record the current. Note if the needle seems to be deflecting to
the left, reverse the leads.
Q25) Does it matter where in the
circuit you place the ammeter?
Explain.
Connect
the ammeter so that it is in series between the two light bulbs.
Q26) Record the current.
Q27) How does the
current recorded in Q26) compare the
current recorded in Q24)?
Connect
the ammeter in series so that it is between the light bulb and the – termainal of the battery.
Q28) Record the current.
Q29) How does the
current recorded in Q28) compare the
currents recorded in Q24) and Q26)?
Q30) What does your
answer to Q29) suggest about the
behavior of current in a series circuit?
Part 4 Ohm’s Law
Introduction
In this experiment we will investigate the relationship between current and potential difference that exists in conductors. This relationship is known as Ohm’s law.
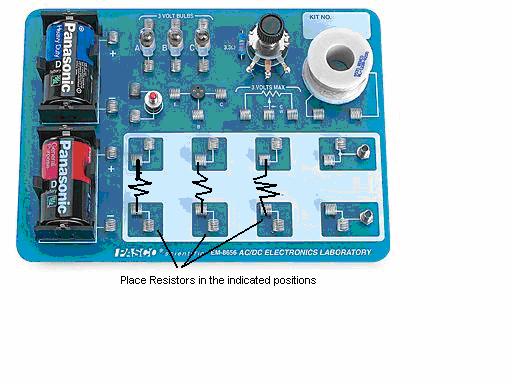
1. Set-Up
. Place 100 Ω, 330 Ω,
and 570 Ω resistors between empty coils on the
.
Make sure that the power supply is turned off. Configure a second DMM to be used as an ammeter by plugging one lead into COM and the other into the socket marked 2 A. Connect the ammeter in series with the resistor and the other DMM configured as a voltmeter across the resistor. This way we will measure the potential across the resistor and the current through it. Before turning on the power supply, check your circuit with the instructor. Incorrect circuits will result in blown fuses and possible damage to the DMM.
2. Using the lowest 5 settings on the power supply, (if the power supply you are using doesn't have a discrete switch then increase the potential in 1 V increments) collect and record Voltage versus current data for the 100 Ω resistor. Record your data in a separate data table, appropriately labeled attached to the report.
3. Reverse the leads to the power supply only, so that you apply a negative potential difference across the circuit. Measure and record Voltage (in V) versus Current (in A) in your data table for the lowest 5 settings on the power supply.
4. Repeat both steps 2 and 3 for the two other resistors.
5. Disconnect the circuit and measure the resistance of each of the three resistors for which you recorded data. Record the measured values in your data table. To measure resistance, use the meter with the lead in the V-Ω socket. Place the leads across the resistor (just like measuring potential) and turn to the smallest setting on the Ω scale which gives a reading. Note, if the scale is marked as kΩ, then you need to interpret the reading as having units of kΩ.
Data Analysis
Using your data for both positive and negative potential differences, construct a graph of Voltage versus Current for each resistor. Answer the following questions.
1. For each graph do your data seem to lie along a line?
2. Does the line seem to go through the origin? (Or at least very close?)
3. What type of relationship is represented by a line that goes through the origin?
4. Find the slope of each line.
5. For each graph, how does the slope of the line compare to the resistance that you measured for the resistor. Compute the % difference between the value obtained from the slope and the measured value.
6. Write an equation for the relationship shown by your graphs, let V stand for potential difference, i for current and R for resistance.
Part 5 Resistivity
Introduction
In this part we will investigate some of the
factors which affect the resistance of a piece of metal. In particular we will examine the dependence
of the resistance on the length of the metal.
Procedure
1.
Connect the 2 D cells on the Pasco circuit board in series and then
connect the battery in series with a light bulb and the connect to the slide
wire Wheatstone Bridge Apparatus (the meter stick with the wire on it.) To connect to the slide wire Wheatstone Bridge apparatus connect to fixed terminal on one side and
connect the other side to the terminal on the metal piece which slides over the
wire. Move the slide close to the fixed terminal and gently push down on the
slide until you make contact with the wire.
The light bulb should now light.
Move the slide 10 cm away from the fixed terminal and gently press down.
Q31)
Is the light bulb brighter or dimmer now?
Q32)
What does this suggest about the resistance in
the circuit?
Move the slide wire another 10 cm
away and repeat.
Q33)
Is the light bulb brighter or dimmer now?
Q34)
What does this suggest about the resistance in
the circuit?
Q35)
As we move the slide away from the fixed
terminal, we include more of the wire in the circuit. What is happening to the resistance of the
circuit as we include more of the wire?
Q36)
What type of relationship does this suggest
exists between the length of the wire and the resistance? Explain.
2. We will now investigate that
relationship. Our apparatus will consist
of a DMM and the Wheatstone Bridge Apparatus.
Connect the probe connected to the common of the DMM to the connector at
the 0 end of the on the Wheatstone Bridge Apparatus. Turn the DMM to the 200 Ω setting. Now, using the other probe measure the resistance
of the wire at 10 cm intervals on the meter stick. Record your data of length of wire and
corresponding resistance in a data table attached to the report.
3. Another measurement to make is the
following. Remove the common probe from
the connector and firmly place the two probes together. Turn the DMM to the most sensitive resistance
setting. You should notice that you
don’t get 0 Ω as you might expect.
The resistance you observe results from the imperfection of the contact
between the two probes and is known as contact resistance. Record your contact resistance in your data
table as well.
4.
Finally, we want to know the cross sectional area of the wire. Use the digital calipers to measure the
diameter of the wire and record the value in your data table.
Data Analysis
We will now analyze our data and
extract from it the resistivity of the material in
the wire. Using Excel or LoggerPro 3.1, plot the resistance that you’ve measured vs.
the corresponding length of wire.
(Remember that it is always y vs. x).
Be sure to label your axes with the quantities they represent including
units and to give your graph a descriptive title. Add the best-fit line that goes through your
data.
Q37)
Record the equation of the best fit line.
Q38)
Does there seem to be a good linear relationship between the resistance
and the length of wire?
Q39)
How does the wire intercept of your line
compare to the contact resistance you measured earlier?
Q40)
Complete the following relationship
R ~ _____
A model of the resistance of a piece
of metal is given by ![]() where R is the
resistance, L is the Length, A is the cross sectional area of the wire, and ρ is a constant which depends on the material
called the resistivity. From our observation of the contact
resistance, we expect that our line probably won’t go exactly through the
origin. We modify our model for the
measured resistance to
where R is the
resistance, L is the Length, A is the cross sectional area of the wire, and ρ is a constant which depends on the material
called the resistivity. From our observation of the contact
resistance, we expect that our line probably won’t go exactly through the
origin. We modify our model for the
measured resistance to
![]() (1) where Rc is the contact resistance.
(1) where Rc is the contact resistance.
Q41) Examine equation (1). The slope of the line you’ve foundrpresents the ratio of which physical quantities.
Q42)
Assume that the wire has circular cross sectionand
calculate the cross sectional area from the diameter of the wire we measured
with the calipers using![]() Remember that radius
is given by
Remember that radius
is given by![]() .
.
Q43)
From the value of the slope obtained from your
best fit line and the cross sectional area you found, determine the resistivity of the material in the wire. Be sure to include
your units. Also be very careful about
units.
Q44) Compare your resistivity to a table given in a handbook such as The CRC Handbook of Chemistry and Physics. What