Introduction
In this lab we will investigate the series LRC circuit. We will construct a series LRC circuit and apply an AC signal. We will measure the amplitude of the potential differences across each of the elements in the circuit and the potential across the entire circuit and explore the relationships between them.
Procedure
1. Setup
We will use the
R = ______________
C = ______________
L = ______________
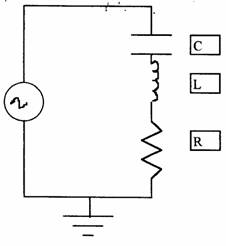
Use the spring clips to connect the components in the order shown in the circuit schematic. (The instructions in this lab will be written assuming you connected the components in the order shown.)
Place the BNC T on the output of the function generator. Turn on the function generator, verify that it is in sine wave mode, and set the frequency to 7.5 kHz. Connect the output of the function generator to channel 1 of the oscilloscope with the BNC cable. Use the BNC – Alligator cable to connect the output of the function generator across the circuit as shown in the schematic. The black cable is connect to ground and so should be connected to the resistor. Turn the oscilloscope on, and press the AUTO SET button. Adjust the amplitude of the output so that it is 5 V. Press the Cursor button. Choose Time and measure and record the frequency of the input sine wave. Switch the cursors to voltage and measure the peak to peak amplitude of the sine wave. The amplitude is ½ the peak to peak amplitude. Be sure to include appropriate units below and everywhere else.
Input Sine Wave
Vin, amp = __________________
Frequency = __________________
Q1) What is the RMS amplitude of the input sine wave?
Vin, rms = __________________
Figure 1 Schematic of circuit layout
2. Measure the amplitude of the potential
across each element and determine the phase relationships
The oscilloscope probes have a switch on them labeled 1x – 10x. Verify that both of the oscilloscope probes are set to the 1x position and connect them to channels 1 and 2 of the oscilloscope, respectively. Connect the probe from channel 2 across the circuit. The alligator clip is connected to ground, so it needs to be connected to the resistor. Press the Auto Set button.
Q2) Measure and record the amplitude as well as RMS potential.
Q3) How do your answers to Q2 compare to what you measured for the output of the function generator? Explain why this is the case.
Now connect the probe from channel 2 across the resistor. The polarity is important here. Connect the hook to the resistor on the side where it connects to the inductor. Clip the alligator clip to the side of the resistor connected to the black lead running to the function generator.
We now wish to make several measurements.
Q4) Measure the amplitude of the potential difference across the resistor and determine the RMS potential. This can be facilitated by using the measurement cursors.
VR,amp = ___________________ VR,RMS = ______________________
Choose time for the measurement cursors again and place one of the cursors at a peak of the signal from the resistor. Be sure to note which cursor you have positioned at the peak of the signal from the resistor, you will use this reference point shortly.
We have a technical issue with the use of the oscilloscope that we have to deal with. The oscilloscope acts like an AC voltmeter except that is always measures the potential between the probe and a reference point of the earth (usually referred to as ground). We have to take this into account in using the oscilloscope or we will simply short out our signal. We will deal with this issue by using the SUBTRACT feature of the oscilloscope.
In a similar manner to how you just connected the probe across the resistor, connect the probe connected to channel 1 at a point between the inductor and capacitor. Connect the alligator clip at the same place as the alligator clip for the other probe is connected. The oscilloscope should now display signals for both channels. If only one shows, press the CH 1 button so that the second shows as well.
The oscilloscope should now display two signals. One is the potential difference across the resistor on CH 2 and the other is the potential difference across the combination of the inductor and the resistor on CH 1.
Q4) If we subtract the signal on CH 2 from CH 1, what do we obtain?
Make sure that the vertical sensitivity for both channels is set to the same value. Press the Math Menu button (located between the CH1 and CH 2 buttons). Choose – as the operation and make sure that CH1 – CH2 is highlighted. The scope will now display three traces. At the left of the screen, they are labeled with a 1 for CH1 a 2 for CH2 and the difference is labeled with an M.
Q5) Measure the amplitude of the potential difference across the inductor and determine the RMS potential. This can be facilitated by using the measurement cursors. To use the measurement cursors again press the Cursor button.
VL,amp = ___________________ VL,RMS = ______________________
CH2 shows the potential difference across the resistor and the difference shows the potential difference across the inductor.
Q6) Are the two signals in phase?
The phase difference, in degrees, is
defined as ![]() , where T is the period and Δt is the time between a
peak in the signal across the inductor and the nearest peak in the signal
across the resistor. Alternatively, the
definition could have 2π to give the phase difference in radians.
, where T is the period and Δt is the time between a
peak in the signal across the inductor and the nearest peak in the signal
across the resistor. Alternatively, the
definition could have 2π to give the phase difference in radians.
To improve accuracy, adjust the horizontal sensitivity so that a little over 1 cycle of the sine waves is displayed.
Q7) Determine the phase difference between VL and VR by measuring Δt and T.
Q8) Which peak, VL or VR, is to the left?
The peak to the left we say leads the other peak.
Q9) Does VL lead VR or is it the other way around?
We now want to make the same set of measurements between the potential difference across the capacitor, VC and the potential difference across the resistor, VR. It turns out that the easiest way to do this is to rebuild the circuit reversing the positions of C and L shown in Figure 1. Switch the positions of the inductor and the capacitor in the circuit and repeat the same measurements that you made for the inductor with the capacitor.
Q10) Measure the amplitude of the potential difference across the capacitor and determine the RMS potential. This can be facilitated by using the measurement cursors. To use the measurement cursors again press the Cursor button.
VC,amp = ___________________ VC,RMS = ______________________
Q11) Determine the phase difference between VC and VR by measuring Δt and T.
Q12) Which peak, VC or VR, is to the left?
Q13) Does VC lead VR or is it the other way around?
We can display the potentials and their phases by using a phasor diagram. In a phasor diagram we treat the potentials like they’re components of a vector. VR is taken to be the x component. Since VL is 90° ahead of VR it is taken as a positive y-component and VC trailing by 90° is taken as a negative y-component.
Q14. Draw a scale phasor diagram for the RMS potentials that you measured in this lab.
Q15. Use the usual rules for vector math to find the magnitude of the RMS potential across the entire circuit, i.e. VR + VL + VC.
Q16) The angle between the net potential and VR is called the phase angle. Determine the phase angle from your measured values.
We can use phasors to derive general expressions for the potential and
the phase.
Q17) For the phasor diagram shown
above, find expressions for Veff and δ in terms of VR,
VL, and VC.
We can express the potentials in terms of the current flowing in the
circuit, viz. VR = iR,
VC = iXC and VL= iXL.
Q18) Substitute the expressions
given above into your answers for Q17 and show that you obtain Veff
= iZ and tan δ = (XL – XC)/R.
Q19) Determine the impedance, rms
current, and the phase for the circuit you have constructed.
Connect the probe on CH 1 across all three elements and connect the probe
on CH2 across the resistor. (You can turn off the math if it makes things too
cluttered.)
Q20) Determine the phase
difference between the two signals.
Q21) Determine the % difference
between your measured phase and the phase you determined in Q19).
Q22) Use the expressions VR
= iR, VC = iXC and VL= iXL to
determine the RMS amplitude across each component.
Q23) Determine the % differences
between the values you determined in Q22 and the corresponding values you
measured earlier in the lab.
Q24) Based on your experience with
this lab, how accurately can you model a series LRC circuit? Justify your answer.