Winplot Basics
Winplot is a fairly easy to use and versatile plotting program for Windows.
It will graph in the plane and in three-dimensional space. It will plot simple
points, functions and equations in 2 and 3 variables, parametric functions,
functions in polar, spherical, and cylindrical coordinates, and slope fields
of differential equations. It will find zeros, intersections, Taylor approximations
at a point, and antiderivatives of functions. It will approximate definite integrals
using left, right, midpoint, trapezoid, and Simpson's rules along with a randomly
generated Riemann sum. And much more.
WARNING: Calculators don't do math;
people do. Always check with your instructor on technology policy and appropriate
use for their class.
This tutorial will help get you started graphing functions of one variable. The objectives listed here are in order, but you can jump to a section if you want. In the tutorial, AUI (Appropriate Use Issue) and OQ (Open Question) remarks appear. AUI remarks are usually important and you should be aware of their content. OQ are questions to which I do not have an answer and you may or may not find it interesting to investigate them.
At your leisure, you may want to investigate more if Winplot's capabilities.
Be assured that this tutorial only scratches the surface and that there are
some very nifty things you can do if you have the time and the interest to discover
them. But, that's always true, isn't it?
Download and Install Winplot
Go to http://math.exeter.edu/rparris and click on "Winplot". There is a description of the program and a history telling when it was last updated. Click on "Winplot" again to download, saving the file to a folder, such as "C:\winplot" (it doesn't have to be on the system drive). The file is not large (less than 700K) and does not take long to transfer. The file that you now have is actually called "winplotz.exe". It is a self-extracting zipped file. Double-clicking on it installs the program "Winplot.exe". Note that it does not have an install shield, does not write to your system registry, or insinuate itself into your operating system. That means that whenever you want to get rid of it, you can safely delete it.
Enter a function
|
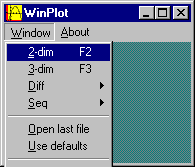
Double-clicking on the yellow
icon opens this window. Click on
"Window" and select "2-dim".
|
|
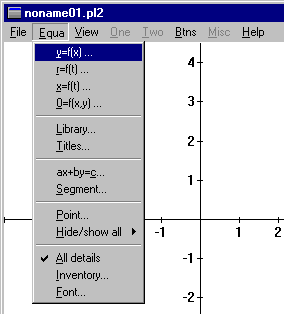
Go to "Equa" on the toolbar and select "y=f(x)".
|
|
|
This will open a dialog box where you can enter the equation and
set the thickness and color of the
graph. (Ignore "lo x" and "hi x" and
"density" for now.) We'll start with polynomials. Notice that the first term I have is "xx". It means "x times x" or "x-squared". You can write this, as well as other exponents as "x^n", where n is the exponent. Click OK to graph. |
.gif)
|
|
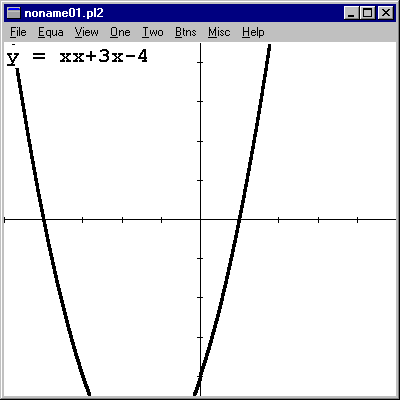
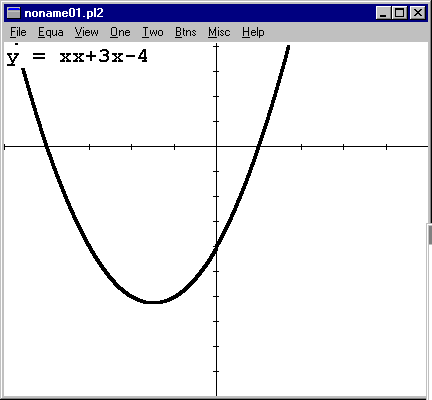
The graph at the right is the polynomial xx+3x-4. In the frames just below, I've got graphs of rational, trigonometric, exponential, logarithmic, and imlicitly defined functions (a circle and an ellipse). The equations are shown in the upper left corner of the graph.
(In the "inventory" box that comes up after the graph, clicking on "equa" will display the equation, "del" will remove the function, "hide" will erase the graph but not the function, "dupl" will make a copy of the selected function, etc.) |
|
|
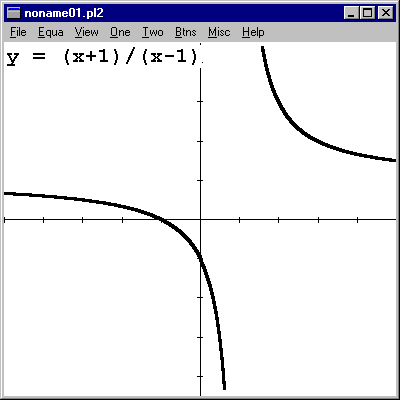
Notice that the vertical asymptote at x = 1 doesn't show up too well. This is typical of graphers. |
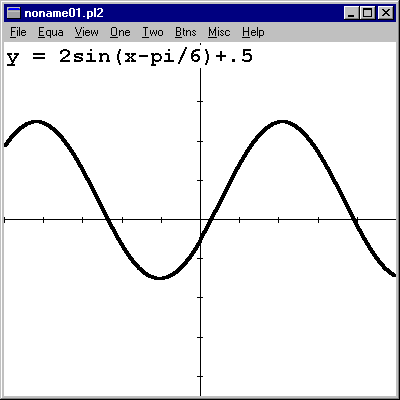
Notice that Winplot interprets "pi" typed out. |
|
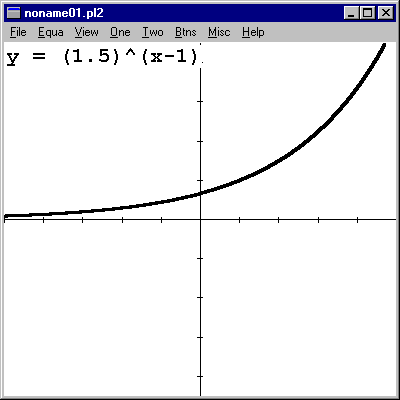
|
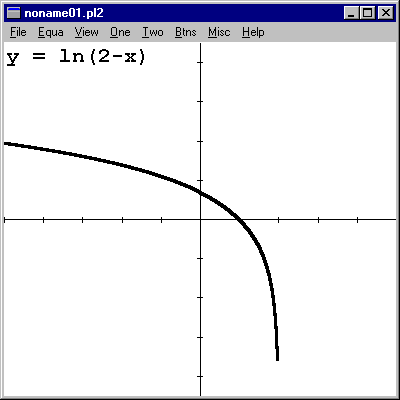
Again, if you don't know what you're looking at, you wouldn't think this function had a vertical asymptote at 2, but it does. |
|
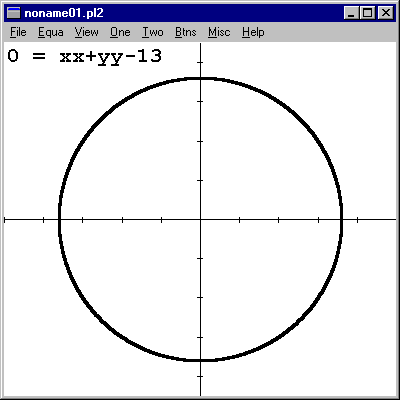
The implicit function feature is nice, but not all of the other features, like EXTREMES, will work with it. Still, it's more than the TI-83 will do. |
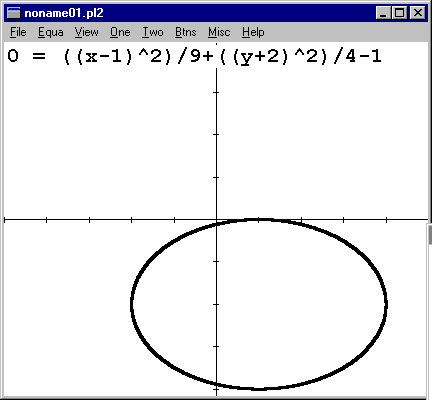
The expressions can get hairy with parentheses, but it's better to be safe than sorry. |
Set the Viewing Window
Graphers are all a bit like cameras; they only take pictures of the field of view.
|
I'm going to use the polynomial "y=xx+3x-4" to illustrate. To set the viewing window, go to "View"->"Set corners". |

|
|
This brings up a dialog box. I'm going to go lower with this one to see the "bottom" of the graph by changing "ver lo" (vertical low)
to -10 |

|
|
The graph changes accordingly.
Note: To restore the default window, go to "View"->"Restore" ("CTRL-R") |
|
ZOOM in and out
Sometimes ZOOM is more convenient than setting a new window.
|
Using "y=xx+3x-4" again in the default window, go to "View"->"Zoom out" or hold down the key "CTRL" while hitting "E". The latter is more convenient if you need to ZOOM more than once. |

|
|
After zooming in 3 times, I have a good view of the bottom of the graph.
Again, to go back to the default window, either zoom back in ("CTRL-S") or "Restore" ("CTRL-R") |

|
TRACE function values and determining accuracy
Turning on the TRACE and scrolling isn't hard. You should pay more attention to the accuracy issues below. Also, the dialog box for tracing has some nifty features but they are discussed in other tutorials.
|
Using "y=xx+3x-4" again in the default window, go to "One"->"Trace" |

|
|
1. Use the scrollbar in the "tracer" dialog box will move the cursor along the graph. (You may not see it at first. Move it slowly and to coordinates that you know are in the filed of view). The position in x and y coordinates are above the scrollbar.
2. From any point on the graph, make a small movement (click once on the arrow at either left or right). Notice how much the coordinates change. This will give you an idea of how "fine" the movement is. If you are using TRACE to estimate something, the small movements will help you figure out the accuracy of your estimate.
3. Now, turn the TRACE off by closing the dialog box. ZOOM in 8-10 times. Turn the TRACE back on. Do a small movement and notice that there is a change in the accuracy. (You have to turn off the TRACE and turn it back on to recalibrate the small movement.) |

|
Use ZEROS to estimate the real zeros of a function
The real zeros of a function are the same as the x-intercepts. (Question for anybody: Why? Question for advanced students: What other zeros are there and why aren't they x-intercepts, too?)
AUI: The
ZEROS feature in some graphers, including Winplot, is not documented; ie, the
accuracy is not known. If you need a certain degree of accuracy, you should
use the TRACE and ZOOM together to estimate. It's more time consuming, but you'll
be certain. Furthermore,
there are algebraic methods taught specifically in some classes and you should
check with your instructor about using this feature.
OQ:
How accurate is the ZEROS feature of Winplot?
|
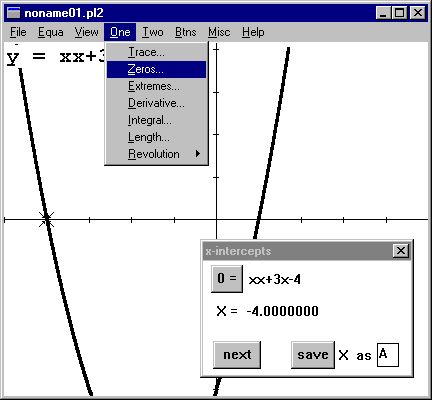
Again, using "y=xx+3x-4" in the default window, we notice that there are two real zeros. The Fundamental Theorem of Algebra says that's the max, so we don't need to look for more.
Go to "One"->"Zeros"
The dialog box appears, along with a cursor (different from TRACE) positioned on the left most x-intercept. The x-coordinate is in the box. Click on "next" to move to the next x-intercept. Not hard, but remember, we have no idea of how accurate this is. |
|
|
Important Technical Notes:
1. ZEROS will report only on the x-intercepts in the current window. It will not automatically go looking for others.
2. ZEROS looks for sign changes in function values, so if the graph of
the function doesn't go through the x-axis (only touches it), ZEROS won't
find it.
|
|
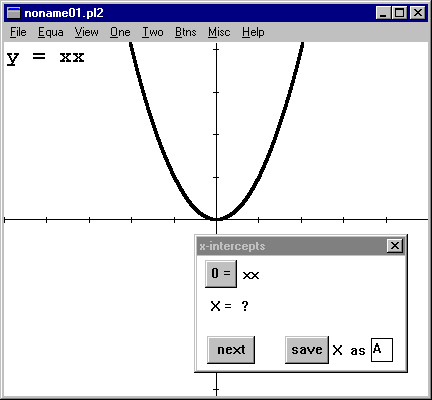
Now let's look at a really simple one, y=xx. All of us know from kindergarden that this function is 0 when x=0.
But look at what happens when you turn on ZEROS!!
That "?" would be depressing, except that we still have ZOOM and TRACE and good old algebra for simple stuff
In short, it's good to have options. |
|
Use EXTREMES to estimate the
local extrema of a function
"Local extrema" is a mathy term for local high and low values of a function.
In Calculus I, this is addressed in more detail.
AUI:
As with ZEROS, the EXTREMES feature in Winplot is not documented; ie, the accuracy
is not known. If you need a certain degree of accuracy, you should use the TRACE
and ZOOM together to estimate. In Calculus I, you will study other methods for
identifying extrema of functions. Graphing technology
is not a substitute for methods taught by your instructor. If in doubt, check
with your instructor about appropriate use.
|
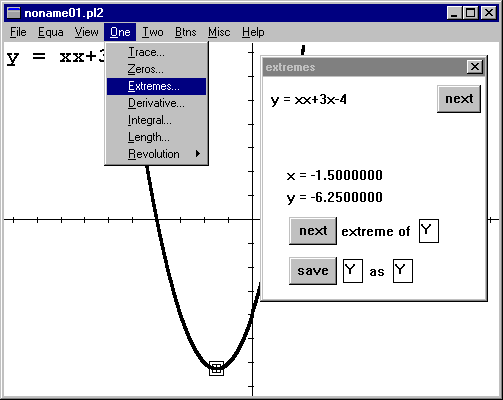
Yep, I'm using "y=xx+3x-4" again. ZOOM out until the bottom
shows up.
Go to "One" -> "Extremes".
Another cursor shows up with a dialog box and both coordinates of the cursor appear.
Click on "next" to find another extreme value. |
|
|
Important Technical Note: Unlike ZEROS, EXTREMES will report on all the local max and min values it finds, not just in the current window. |
|
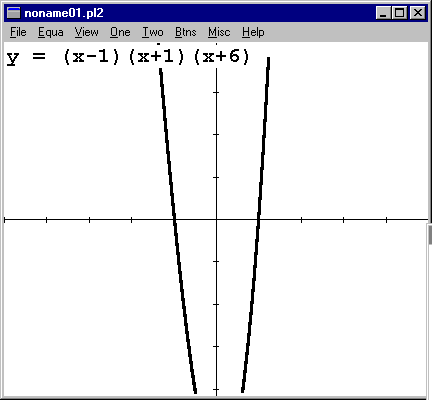
Look at this function.
It has a local max and a local min, but you can't see them in this window. However, EXTREMES reports them both. Try it (before zooming out to see it better).
OQ: How do you think EXTREMES works? |
|
Help files
To find additional help with Winplot features, search the Help using a keyword.
Exercises
1. Graph  n the
default window. Zoom out until you think you have the best display of the graph.
2. Graph  two ways:
using the implicit function feature and by splitting it into 2 equations.
3. Graph  using
"0=f(x,y)". What is the graph of this equation?
4. Estimate the zeros of 
5. Estimate the maximum value of  for x > 0
6. Estimate the minimum value of  for x < 0
Check answers.


.gif)


