Manipulate / Math toys
![]()
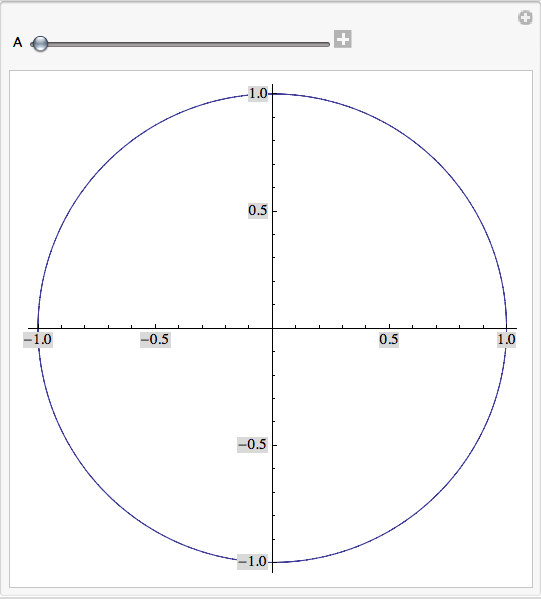
Not much different than Animate, so far. However, you can use as many sliders (and other controls, if you want to look up the details in the Mathematica Help):

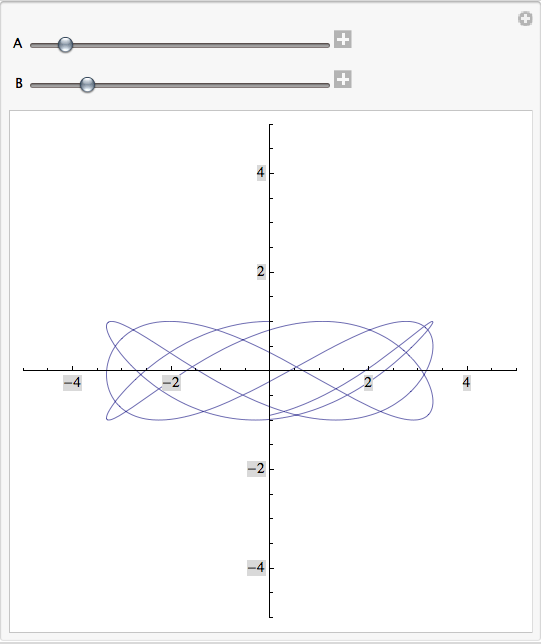
I used the AxesOrigin→{0,0} to tell Mathematica to only show the coordinate axes at (0,0). (I have no idea why they don't make this the default; the default will move them around so you can aways see them...) I used PlotRange to keep the view window steady.
You can also use Manipulate to change the settings for the graph:

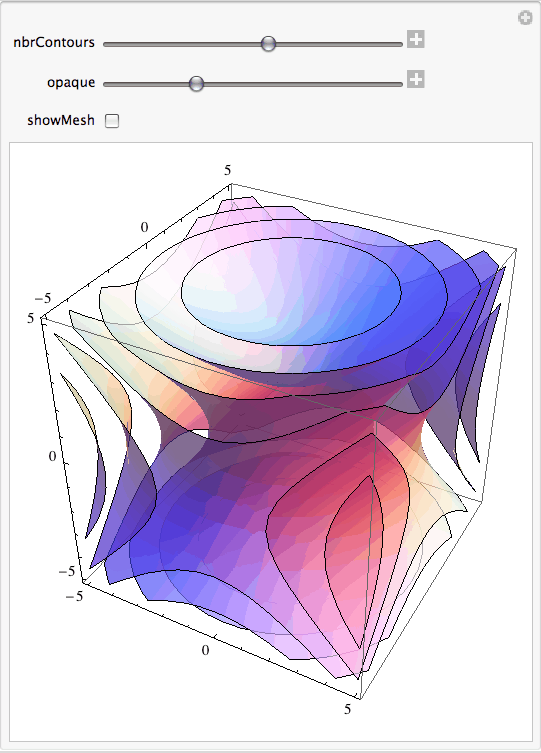
More complicated controls are also available, if you want to learn to use them:
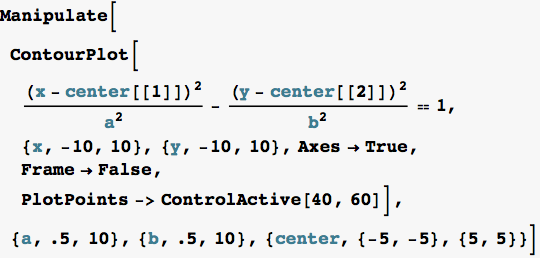
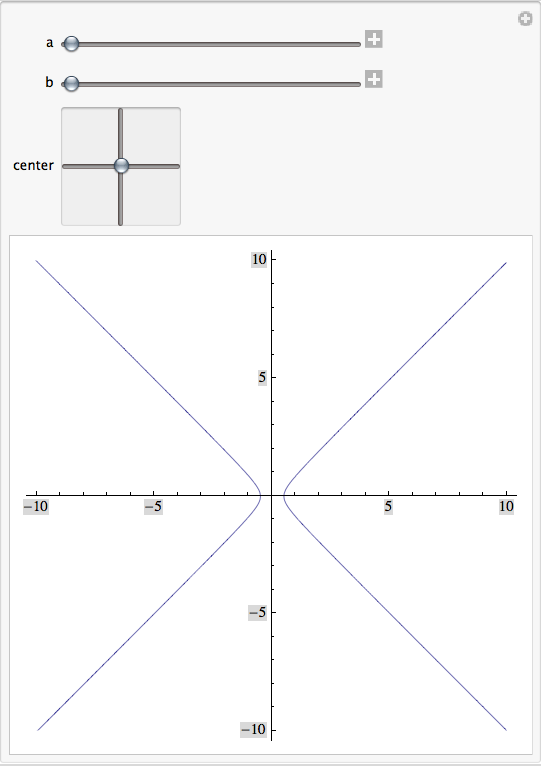
Notice my use of PlotPoints→ControlActive[40, 60] here. If you cut that part out, the graph looks terrible while you move the controls (Mathematica decreases the number of PlotPoints while you move the controls so it will respond quickly and smoothly). So, this tells Mathematica to use PlotPoints→40 while moving controls and 60 afterwards, which seems to work better. (This is a handy trick if your graph looks really awful while you move the controls.)
| Created by Wolfram Mathematica 6.0 (07 February 2008) |